
How Decision Trees Improve Risk Assessment
Decision trees simplify complex decisions by visually mapping out choices, uncertainties, and outcomes. They help you quantify risks, calculate probabilities, and make data-driven decisions. Here's why they work:
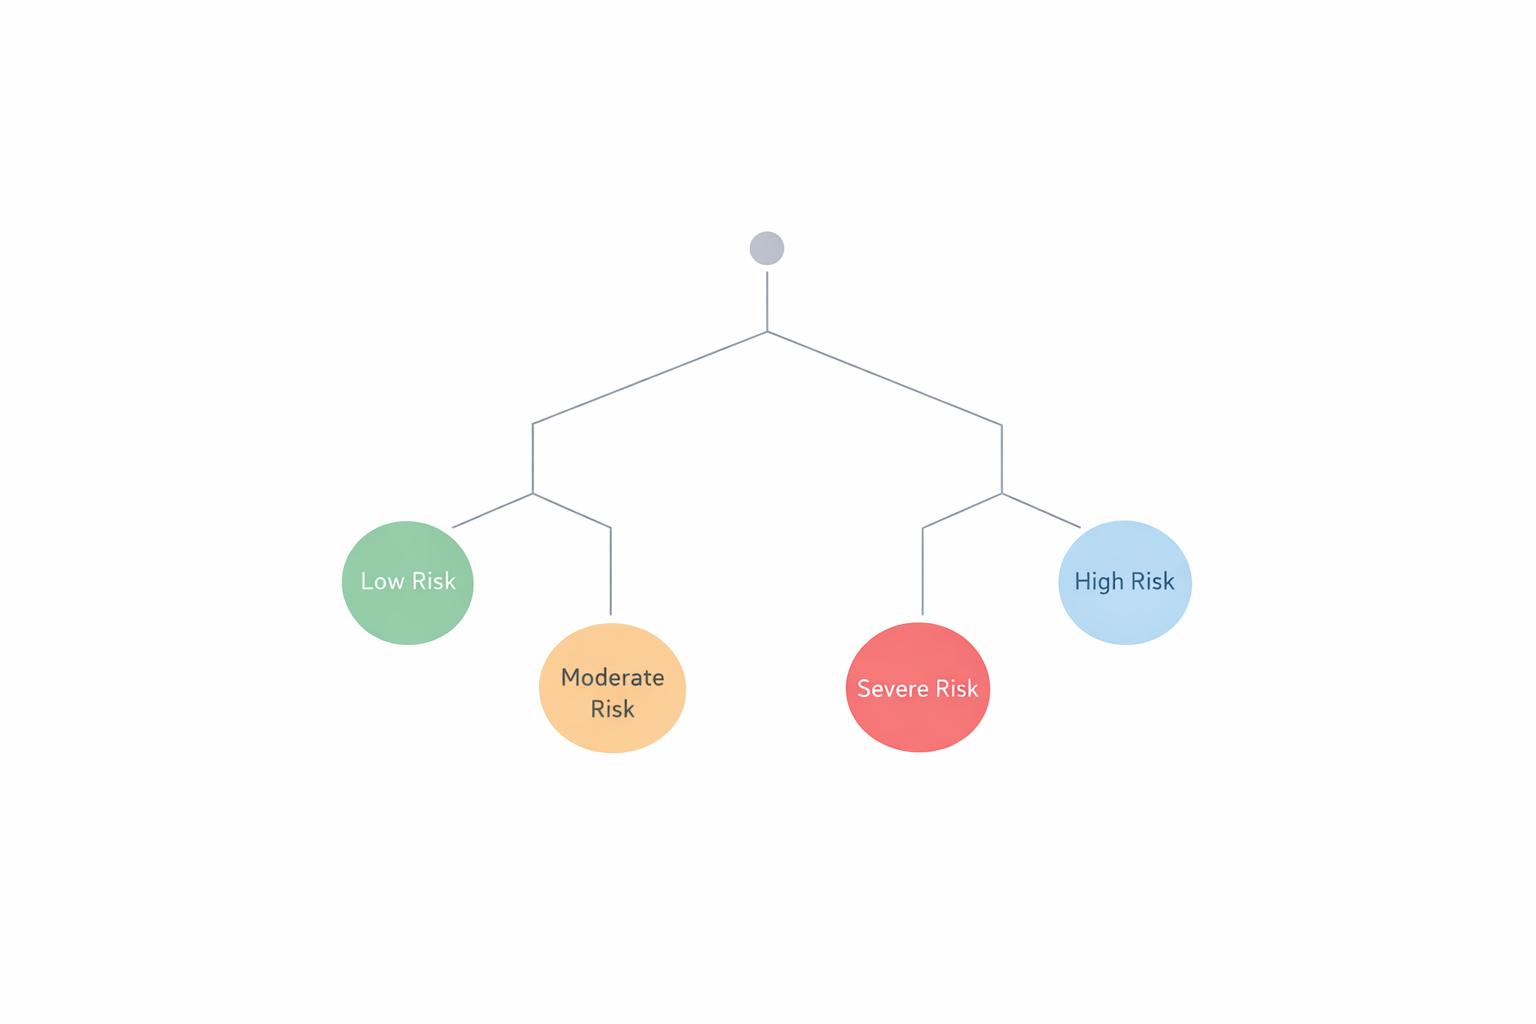
- Clear structure: Decision trees break decisions into steps using decision nodes (choices), chance nodes (uncertainties), and end nodes (outcomes).
- Risk quantification: Tools like Expected Monetary Value (EMV) assign financial values to risks, making them measurable.
- Practical application: They are widely used in project management, healthcare, and vendor selection to minimize uncertainties and improve decision accuracy.
- Data flexibility: Decision trees handle messy data and non-linear relationships without requiring extensive preprocessing.
Risk Quantification - Making Decision with Decision Tree
How Decision Trees Work
Decision trees visually break down complex decisions, helping you see where you have control and where uncertainty comes into play. John R. Schuyler, Principal at Decision Precision, describes their value like this:
"The diagram acts as a blackboard to document our understanding of a situation. This facilitates team collaboration, communication and instruction." [5]
Key Components of Decision Trees
A decision tree has three main parts: decision nodes (squares) where choices are made, chance nodes (circles) that represent uncertainties, and terminal nodes that show final outcomes, often expressed in monetary terms.
One of the biggest advantages of decision trees is their ability to calculate Expected Monetary Value (EMV) at each chance node. EMV is determined by multiplying the probability of each outcome by its financial impact and then summing these values. David Hulett, Ph.D., from Hulett & Associates, explains:
"The value of each chance node is found by multiplying the values of the uncertain alternatives by their probabilities of occurring and sum the results. This value is known as Expected Monetary Value (EMV)." [2]
To solve a decision tree, analysts use a technique called "folding back", which works from right to left. At decision nodes, the branch with the highest EMV is selected. At chance nodes, the weighted average of all possible outcomes is calculated. It's critical that the probabilities for all outcomes at any chance node always add up to 100%.
By breaking down these elements, decision trees turn vague uncertainties into clear, actionable pathways.
Visualizing Risks with Decision Trees
The structure of a decision tree makes risks easier to understand by separating what you can control (decision nodes) from what you can't (chance nodes). This clarity is especially useful in project management, where distinguishing between strategic decisions and external uncertainties is crucial.
Risk tolerance plays a big role here. For instance, a risk-neutral organization might focus strictly on EMV, accepting occasional losses as long as the overall portfolio performs well. On the other hand, risk-averse organizations often prioritize Expected Utility over EMV. For example, a $100 loss might be valued at -369 "utils", while a $100 gain is seen as only +100 "utils" [6][1]. These differences highlight why decision trees are so helpful in risk assessments - they reveal how potential losses can carry a much heavier emotional or strategic weight than equivalent gains.
Research Findings: How Decision Trees Impact Risk Assessment
Improved Project Success Rates
Organizations that adopt structured decision-making tools, like Decision Tree Analysis, are far better equipped to make project choices that lead to successful outcomes [1]. Recognized as a key method for Quantitative Risk Analysis in the PMBOK Guide, decision tree analysis stands out for its ability to tackle complexity and minimize uncertainty [5][2].
What makes decision trees so effective? They compel project teams to clearly distinguish between actions they can control (decision nodes) and uncertainties beyond their control (chance nodes) [5][9]. This clear, visual breakdown allows teams to evaluate all possible scenarios at a glance, removing the guesswork and incomplete evaluations often associated with decision-making.
On top of this, Expected Monetary Value (EMV) takes risk evaluation a step further by turning uncertainties into measurable financial terms.
Risk Reduction through Expected Monetary Value
EMV simplifies risk quantification by assigning numerical values to uncertainties. The formula is simple: multiply the likelihood of a risk occurring by its potential financial impact [11]. For instance, a risk with an 80% probability and a $30,000 impact results in an EMV of $24,000. This figure represents the "value of the risk" rather than the actual cost if the event occurs [10].
"Expected monetary value can be useful in planning realistic costs for a given event" [10]
Alan Gump, West Coast Professional Development Manager at PMSI Project Mentors, highlights how EMV can guide practical decision-making. Take vendor selection, for example: Vendor A offers a bid of $100,000 but has a 50% chance of a $15,000 delay (EMV = $107,500). Vendor B, on the other hand, bids $105,000 with only a 5% chance of delay (EMV = $105,750). Despite the higher upfront cost, Vendor B emerges as the less risky option when all factors are considered.
sbb-itb-8feac72
Advantages of Decision Trees Over Other Methods
Core Advantages and Metrics
Decision trees bring a unique edge over traditional risk assessment techniques, largely because they demand minimal data preparation. Unlike linear regression, which requires datasets to be clean, free of missing values, and adhere to specific distribution assumptions, decision trees can handle raw, messy data with ease [3]. They work seamlessly with a variety of data formats and structures, reducing the need for extensive preprocessing. This makes them a powerful tool for delivering reliable, data-driven insights.
Their visual nature is another standout feature. As Eda Kavlakoglu from IBM Research explains:
"The Boolean logic and visual representations of decision trees make them easier to understand and consume" [3]
This clarity is particularly helpful when presenting findings to non-technical stakeholders, ensuring everyone can follow the logic behind decisions.
Because they are non-parametric models, decision trees can identify non-linear relationships without being constrained by predefined patterns [4]. This flexibility is especially useful when working with skewed datasets or outliers, as they process such complexities without requiring extensive data transformations.
Decision trees also rely on measurable metrics like Gini impurity and information gain to guide their splits. Lower Gini values and higher information gain signify better differentiation between risks [3]. These metrics help ground decisions in data, reducing the need for subjective interpretation.
Comparison Table: Decision Trees vs. Other Methods
The table below highlights how decision trees compare to other popular methods like linear regression and Monte Carlo simulations.
| Feature | Decision Trees | Linear Regression | Monte Carlo Simulations |
|---|---|---|---|
| Data Structure | Non-parametric; handles non-linear data [3] | Parametric; assumes linearity [12] | Probabilistic; relies on distributions [1] |
| Interpretability | High (visual flowchart) [3] | Moderate (coefficients) | Low (statistical distributions) |
| Missing Data | Robust; handles automatically [3] | Sensitive; requires imputation [12] | Requires complete input distributions |
| Risk Modeling | Can use non-linear utilities [1] | Typically uses linear EMV | Focuses on probability of outcomes [1] |
| Multicollinearity | Insensitive; chooses one correlated feature [3] | Highly sensitive; distorts results | Requires careful variable selection |
Decision trees go beyond basic risk assessment by allowing for more nuanced evaluations. For instance, they can integrate Expected Utility to reflect risk asymmetries. This means they can capture scenarios where, for example, a $100 loss might equate to -369 "utils", while a $100 gain only adds +100 "utils." This level of detail is often overlooked by linear EMV approaches [1].
Steps to Implement Decision Trees for Risk Assessment
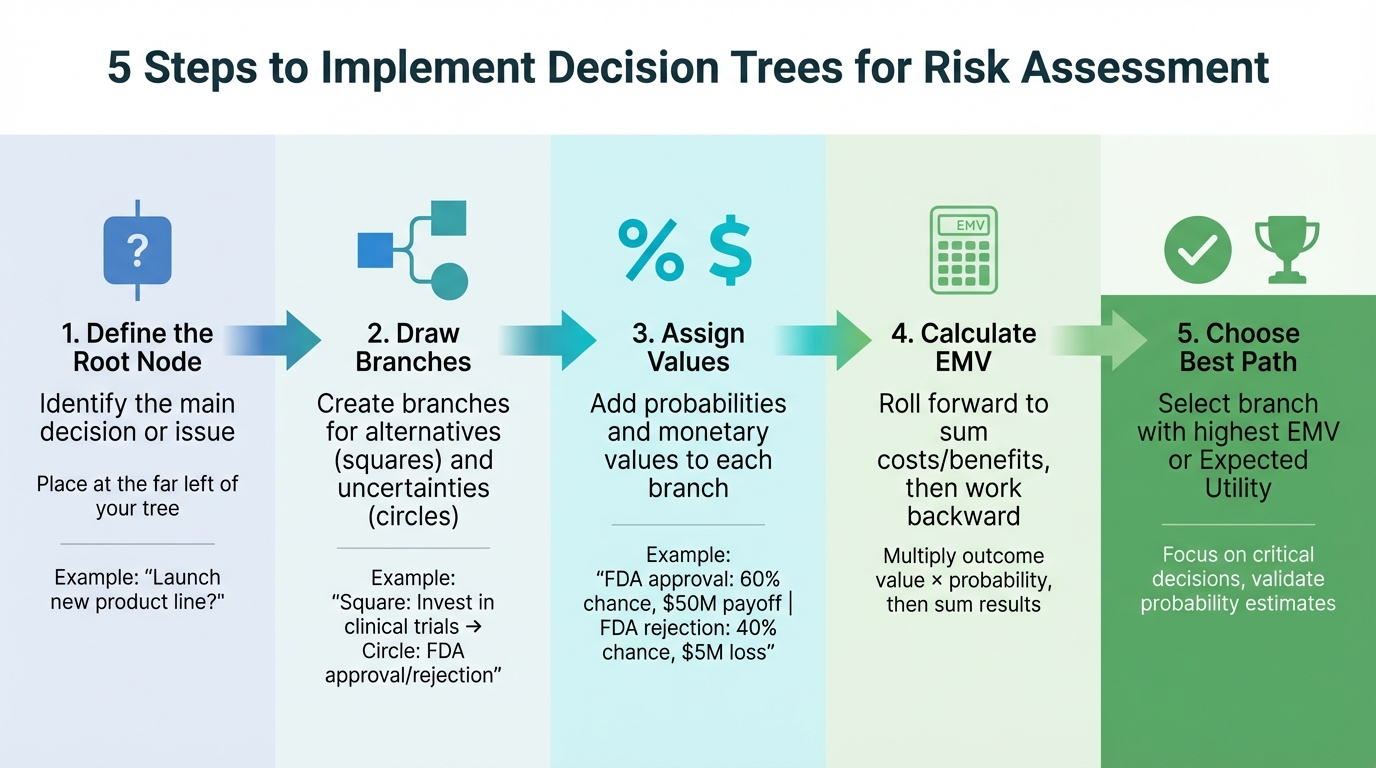
How to Implement Decision Trees for Risk Assessment: 5-Step Process
Step-by-Step Process
Implementing decision tree analysis for risk assessment involves a structured, straightforward approach. Here's how you can do it:
Start by defining the root node, which represents the main decision or issue you're analyzing. This node sits at the far left of your decision tree [8][5]. For instance, if you're evaluating whether to launch a new product line, that decision becomes your starting point.
From the root node, draw branches to represent alternatives (squares) and uncertainties (circles) [2][5]. For example, a pharmaceutical company might create a square branch for "invest in clinical trials" and add circular branches for "FDA approval" and "FDA rejection."
Next, assign probabilities and monetary values to each branch. Estimate the likelihood of uncertain events and attach corresponding financial outcomes [13][2]. For example, if FDA approval has a 60% chance of success with a $50 million payoff, and rejection has a 40% chance resulting in a $5 million loss, these figures are added to the respective branches.
Calculate the expected outcomes by first rolling forward to sum all costs and benefits along each path. Then, work backward to determine the Expected Monetary Value (EMV). This involves multiplying each outcome's value by its probability and summing the results [13][2][5].
Finally, choose the branch with the highest EMV or Expected Utility. To keep your decision tree manageable, focus only on critical decisions and avoid unnecessary complexity [6][1][5]. Be meticulous when validating your probability estimates, as even small changes can significantly alter the optimal path [8].
Conclusion
Decision trees simplify organizational risk assessment by breaking down complex, uncertain scenarios into clear, visual pathways that are easy to follow. Rather than relying on instincts or single-point estimates that can mislead, this method requires you to map out all possible outcomes, assign realistic probabilities, and calculate the expected value for each option [7].
A key advantage is the ability to separate controllable decisions from external uncertainties. This distinction becomes even more critical when you consider your organization's specific risk tolerance - whether you're inclined to pursue higher average returns or prefer to avoid risks that could lead to catastrophic outcomes [1]. With decision trees, you can clearly identify risk concentrations and assess them in alignment with your strategic goals.
Decision trees also excel at illustrating and analyzing uncertainty:
"The decision tree technique offers a powerful way of describing, understanding and analyzing uncertainty, and can be a valuable part of the toolkit for any project manager who needs to make decisions where the outcome is uncertain." [2]
Their visual format significantly enhances communication with stakeholders. Presenting a branching diagram backed by transparent calculations demonstrates a data-driven approach, fostering consensus and reducing bias [4].
FAQs
What role does Expected Monetary Value (EMV) play in risk assessment and decision-making?
Expected Monetary Value (EMV) is a tool used to assess risks by linking their likelihood of happening with their possible financial consequences. By working out the EMV for different scenarios, decision-makers can weigh options and pinpoint the one that offers the greatest possible gain or the smallest potential loss.
This method provides a clear framework for tackling complex decisions, helping ensure choices are informed by data and focused on achieving the best financial results while keeping risks in check.
What makes decision trees a better choice for risk assessment compared to other methods?
Decision trees are highly regarded for their visual clarity in risk analysis. By presenting decisions, potential events, and outcomes in a flowchart-like structure, they simplify complex scenarios, making it easier for teams to collaborate and for stakeholders to grasp the reasoning behind choices. This approach ensures even non-technical participants can follow along, fostering better communication and alignment.
Beyond their visual appeal, decision trees provide a quantitative framework for assessing risks. They allow teams to assign probabilities and monetary impacts to each branch, calculating the expected monetary value (EMV) for different options. This helps organizations weigh alternatives while considering their risk tolerance. Unlike methods such as Monte Carlo simulations, decision trees excel at modeling sequential decisions and comparing various paths. Their blend of simplicity, analytical depth, and adaptability makes them an essential tool in risk evaluation.
How do decision trees manage incomplete or messy data?
Decision trees are great at handling incomplete or messy data because they don’t need every input to be perfectly filled out. If a piece of data is missing, the tree can simply bypass that specific decision point or use a surrogate split - a method that substitutes a similar variable to guide the process in a logical direction.
To tackle uncertainty even further, advanced algorithms treat missing or uncertain data as probability distributions instead of fixed values. This allows the tree to evaluate multiple potential outcomes for the missing data and make decisions based on aggregated probabilities. These techniques not only boost accuracy but also preserve the model’s clarity, even when dealing with complex, high-dimensional, or partially observed datasets.