
Facilitating Stakeholder Workshops with Visual Tools
Visual tools can transform stakeholder workshops into productive, interactive sessions. They help teams align, simplify complex ideas, and resolve conflicts faster by turning abstract concepts into shared visuals like diagrams, sticky notes, and process maps. Here's what you need to know:
- Why Visual Tools Work: The brain processes visuals 60,000 times faster than text, making them ideal for collaboration. Structured visuals improve understanding by 323% and help resolve disagreements 40% faster.
- Key Tools: Popular platforms include Miro, Mural, FigJam, and frameworks like empathy maps, flowcharts, and Kanban boards. These tools often come with AI features to automate tasks like agenda creation and note grouping.
- Workshop Goals: Align stakeholders, generate ideas, and produce actionable outputs such as project roadmaps or prioritized initiatives.
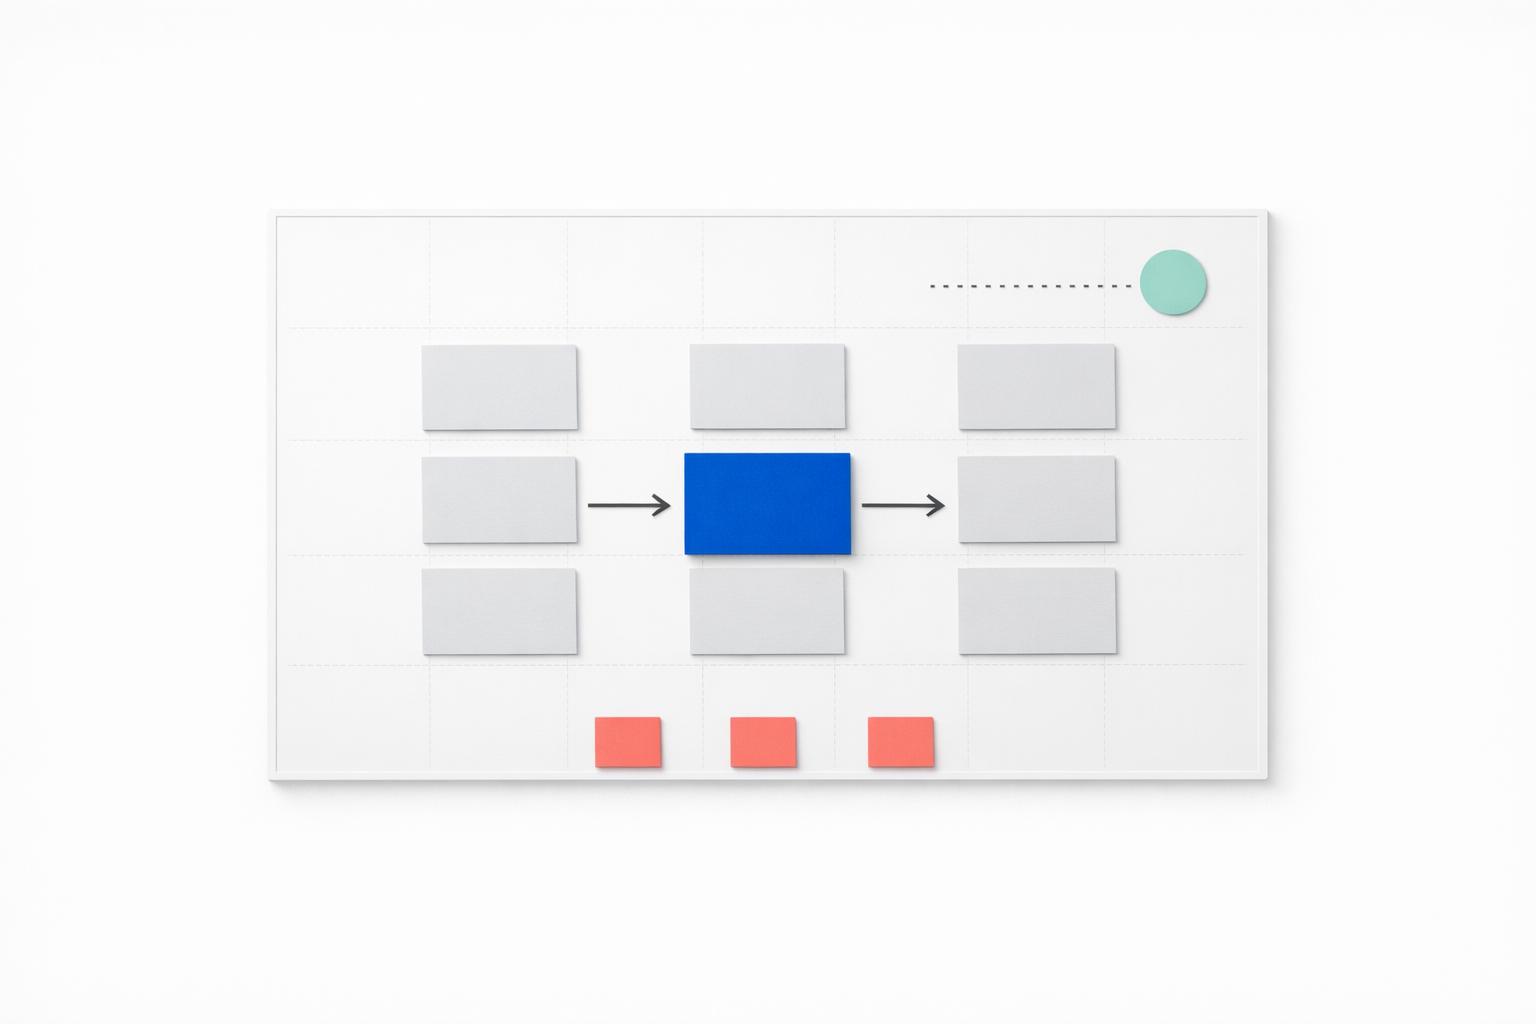
- Planning Tips: Spend 80% of your effort on preparation. Use clear objectives, structured agendas, and the "diamond pattern" (divergence to convergence) for success.
- Engagement Strategies: Encourage active participation with virtual sticky notes, private modes for unbiased input, and live collaboration features like timers and voting.
Takeaway: Visual tools are essential for making workshops more efficient, engaging, and results-driven. Proper planning, the right tools, and clear objectives ensure long-term alignment and actionable outcomes.
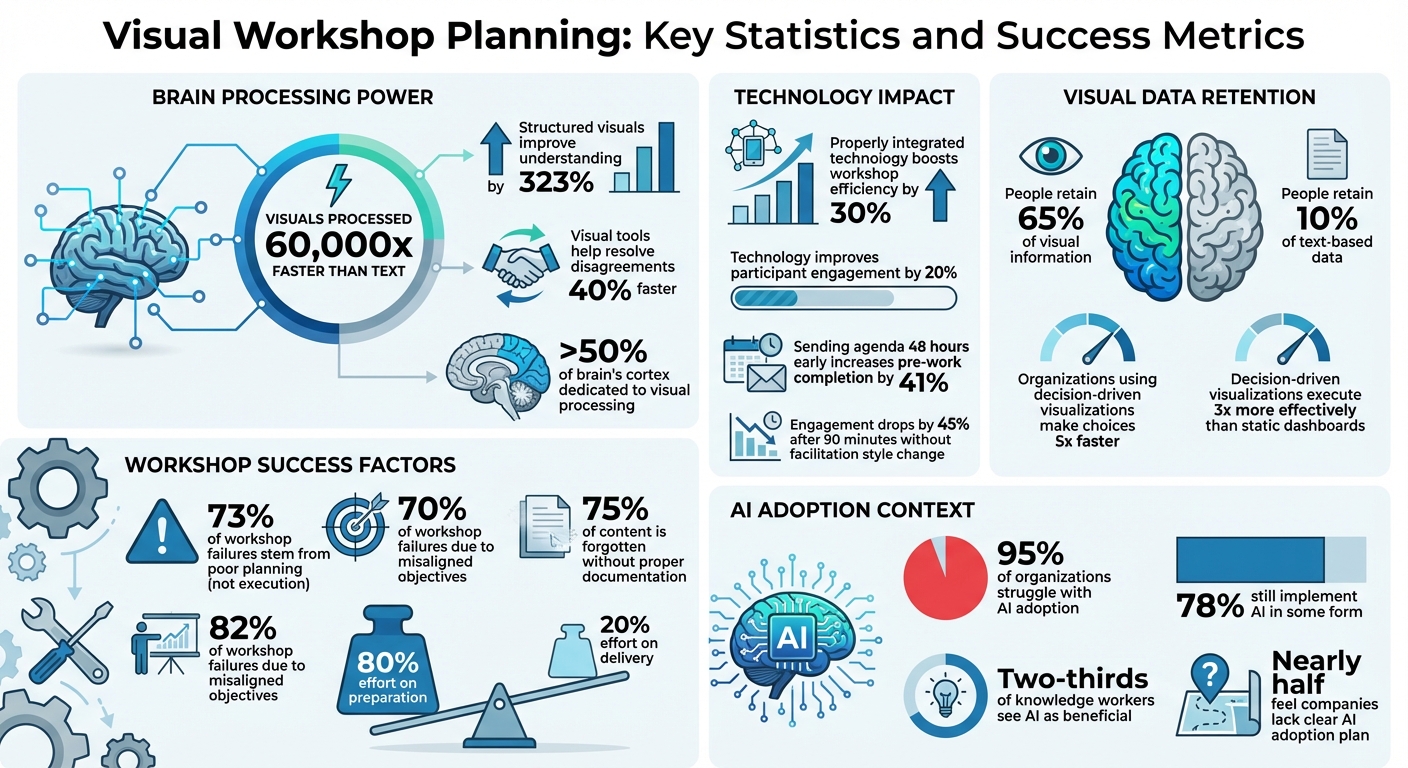
Visual Workshop Planning: Key Statistics and Success Metrics
Facilitation Skills - How To Visualize Information
sbb-itb-8feac72
Planning Stakeholder Workshops with Visual Tools
Did you know that 73% of workshop failures stem from poor planning rather than what happens during the session itself [4]? Using visual tools effectively can simplify the planning process and set the stage for success.
Selecting the Right Visual Tools
The key to choosing the right tool lies in aligning it with your workshop's phase and goals. For brainstorming and idea generation, platforms like FigJam or Miro are ideal, offering freeform design and creativity. When it’s time to prioritize or make decisions, look for tools with built-in features like voting and clustering. Your team size and tech needs also play a role - platforms like Whimsical work well for smaller, agile teams, while enterprise-grade tools like Miro or Mural are better suited for larger groups needing integrations with tools like Jira, Slack, or Trello [6][8].
Properly integrated technology can boost workshop efficiency by 30% and improve participant engagement by 20% [5].
Before choosing a tool, define the artifact you need. For example:
- If you’re aiming for a polished report, Stormboard is a solid choice.
- For design flows, FigJam or Figma are better suited [7][8].
Once tools are selected, focus on setting clear objectives and creating a structured agenda.
Setting Clear Objectives and Agendas
Clear objectives ensure workshops are productive and interactive. Define your goals as tangible outputs, like “Prioritized list of Q2 initiatives,” rather than vague aims like “Align on strategy” [9].
Stakeholder interviews are a must. Speak to 3–7 stakeholders one to two weeks before the workshop to uncover the main business problem and identify hidden agendas. Misaligned objectives account for 70% of workshop failures [9].
Use the diamond pattern to structure your agenda:
- Opening: Allocate 10–15% of the time to set the stage.
- Divergent phase: Spend 30–40% generating ideas.
- Convergent phase: Dedicate another 30–40% to prioritization.
- Closing: Use the final 10–15% to wrap up [4].
Always include a 15–20% buffer and prepare “accordion activities” like dot voting, which can be expanded or shortened based on how the session unfolds [4].
| Workshop Goal | Recommended Duration | Recommended Tool Type |
|---|---|---|
| Quick decision/alignment | 60–90 minutes | Polling (Slido) / Simple Whiteboard (Whimsical) |
| Ideation/Brainstorming | 2–3 hours | Creative Whiteboard (FigJam, Miro) |
| Strategy/Planning | 4 hours (Half day) | Structured Whiteboard (Mural, Lucidspark) |
| Complex Problem Solving | Full day | Facilitation Platform (Stormz, Klaxoon) |
Keep the workshop goal visible throughout the session by placing it at the top of your digital whiteboard. Once the agenda is set, it’s time to prepare participants for seamless visual collaboration.
Preparing Participants for Visual Collaboration
Send out a detailed agenda at least 48 hours before the workshop. This simple step can increase pre-work completion rates by 41% [9]. Include any necessary frameworks, data, or reference materials to minimize cognitive overload during the session [9].
Before starting, conduct a 15-minute tech check to ensure everyone can access the platform. Provide quick tips on basic functions like zooming, adding sticky notes, and navigating the board [4][11]. Lock down elements like backgrounds and headings to prevent accidental edits [10].
Set expectations early by establishing ground rules, such as camera use and communication protocols [4][11]. Kick things off with an icebreaker to help participants get comfortable with the platform. For sensitive discussions, use features like Private Mode to encourage contributions, especially from junior participants who might hesitate to speak after senior leaders [9][10].
In hybrid setups, assign a remote advocate to ensure virtual attendees are heard. Use built-in timers to keep activities on track - engagement tends to drop by 45% after 90 minutes without a change in facilitation style [9].
Running Workshops with Interactive Visual Tools
Interactive visual tools are game-changers for workshops, helping teams stay aligned from the moment the session begins. Their rising popularity reflects how modern teams collaborate across disciplines and roles [16].
Using Interactive Whiteboards for Real-Time Collaboration
Interactive whiteboards simplify complex collaboration by keeping everyone focused. Tools like Miro and Microsoft Whiteboard offer features such as "Bring Everyone to Me" or "Follow", which sync participants' views to a specific area. This is especially useful when guiding stakeholders through detailed frameworks or gradually revealing insights, ensuring no one gets lost in the process [12][15][10].
Real-time features like live cursor tracking let you see participants' actions as they happen, while emoji reactions provide a subtle way to gather feedback [12][14][15]. To manage structured ideation, frames act like slides within the workspace - content can be hidden and revealed strategically to avoid overwhelming participants [12][14][10].
"Miro allowed us to continue to work in the collaborative way we are used to, without creativity, alignment, and productivity taking a hit." – Roxanne Mustafa, Design Team Lead, VMWare [14]
Private Mode is another valuable feature, allowing participants to draft sticky notes anonymously before sharing with the group. This encourages input from quieter team members. Modern whiteboards also leverage AI to group sticky notes by topic, create mind maps from a single idea, and summarize lengthy discussions into actionable insights. Even physical sticky notes can be digitized using tools like "Stickies Capture" [14][2].
To keep the session moving, use built-in timers for each activity. Once focus is established with these tools, the next step is mapping stakeholder relationships visually.
Stakeholder Mapping with Visual Frameworks
Visual frameworks make abstract stakeholder relationships tangible and actionable. A common tool is the Power-Interest Matrix (Mendelow's Matrix), which organizes stakeholders into four categories: Manage Closely, Keep Satisfied, Keep Informed, and Monitor. This method is essential, as poor communication contributes to 56% of projects failing to meet their goals [21][22][24].
Start stakeholder ideation in Private Mode to minimize bias [23]. AI clustering can then group stakeholders into categories like "Internal", "External", or "Regulatory" [23][24]. You can also map informal power structures by connecting notes - for instance, a Senior Engineer with low formal authority but high influence on team morale [22].
"Stakeholder mapping is not a task you check off the list during the Kick-off meeting. It is a continuous mindset." – AFFiNE [22]
For complex projects, tools like Empathy Maps can help visualize what stakeholders say, think, feel, and do, enabling customized communication strategies. The RACI Bullseye organizes accountability levels (Responsible, Accountable, Consulted, Informed) using concentric circles [24]. Stakeholder notes can even be turned into "profile cards" or tasks to track requirements and follow-ups, with LinkedIn URLs generating professional profiles directly on the board [20].
Looking ahead, "living maps" that update stakeholder roles in real time are becoming more common, allowing teams to adapt as projects evolve [22]. This approach ensures clarity and actionable outcomes throughout the workshop.
With stakeholder roles clarified, the next focus is energizing idea generation with virtual sticky notes.
Brainstorming with Virtual Sticky Notes
Virtual sticky notes combine the hands-on feel of physical notes with the efficiency of digital tools. Studies show that using technology in workshops can increase efficiency by 30% and boost engagement by 20% [19]. The key is separating idea generation from evaluation - encourage participants to generate as many ideas as possible before assessing them [18].
Kick things off with 5–10 minutes of silent brainstorming to ensure diverse input [18][10]. Encourage bold ideas and focus on quantity, as refining a daring idea is easier than starting over from scratch [17][18]. Adopt a "Yes, and…" mindset to build on others' contributions [18].
"It is easier to tone down a wild idea than to think up a new one." – Alex F. Osborn, Advertising Executive [17]
Once ideas are generated, use affinity mapping to group related sticky notes into clusters, uncovering patterns that might be missed in linear lists [18][2]. Digital voting features can help prioritize the best ideas quickly [18][10]. Color-coded sticky notes add context, with specific colors representing departments, individuals, or categories like risks and opportunities [15].
Tools like Miro, Mural, and FigJam now use AI to automatically group sticky notes and summarize discussions [2]. For asynchronous work, "brainwriting" allows participants across time zones to contribute ideas before a live session [17][18]. To ease participants into the process, include a simple "Start Here" section or a quick challenge to practice using sticky notes [13].
These methods not only spark creativity but also align ideas with strategic goals, ensuring workshops lead to actionable results.
Analyzing Workshop Outcomes with Visual Data
After a workshop, turning stakeholder feedback into actionable insights is key. Visual data tools can help organize scattered feedback into clear patterns, making it easier to shift from discussion to implementation.
Converting Stakeholder Input into Visual Insights
Presenting feedback effectively means focusing on what truly matters. Tools like data bars - small bar charts embedded in spreadsheet cells - allow for quick visualization of agree/disagree scales [25].
Organize data by importance: arrange feedback categories from most to least mentioned, and emphasize "Strongly Agree" and "Agree" responses over neutral ones to highlight critical issues [25].
Simplify visuals by removing unnecessary elements. For instance, round percentages like 88.89% to 89%, avoid double borders, and minimize gridlines. Studies reveal that people retain 65% of visual information compared to just 10% of text-based data [26]. Adding icons alongside charts can further emphasize key points [25].
"The purpose of visualization is insight, not pictures." – Ben Shneiderman, Distinguished University Professor Emeritus, University of Maryland [26]
Ensure clarity with a strong text hierarchy and use a landscape format for better readability on screens. Stick to consistent brand colors to map feedback themes effectively [25].
Next, explore how visual tools can enhance stakeholder engagement strategies.
Comparing Stakeholder Engagement Strategies
Adapting engagement strategies to stakeholder needs is crucial. Visual tools like the Power-Interest Matrix help tailor these strategies for large projects, while network diagrams are more suited for smaller, interaction-heavy initiatives [20].
| Stakeholder Category | Power/Influence | Interest/Involvement | Engagement Strategy |
|---|---|---|---|
| Actively Engaged | High | High | Manage closely; involve in key decisions. |
| Keep Satisfied | High | Low | Meet their needs; keep them updated to ensure buy-in. |
| Keep Informed | Low | High | Use as a sounding board; keep updated on progress. |
| Monitor | Low | Low | Minimum effort; monitor for changes in interest/power. |
Organizations that use decision-driven visualizations make choices five times faster and execute three times more effectively than those relying on static dashboards [26]. For example, in early 2024, Vanguard introduced animated time-series visualizations in their retirement planning tools. These allowed clients to see how their savings could grow under different scenarios, resulting in a 32% increase in subscriptions to long-term savings plans [26].
Tracking Progress and Accountability
Building on these strategies, tracking progress and ensuring accountability can be achieved through visual monitoring. The insights gathered earlier should guide follow-ups and measure decision-making efficiency. These steps ensure workshop insights translate into better collaboration with stakeholders.
AI-powered flowcharts and dashboards can map decisions, track progress, and update stakeholder roles in real time. Modern tools transform workshop outputs into actionable documents [3].
Set up dashboards to monitor decision speed - the time it takes to move from data presentation to actionable decisions - as a key measure of workshop impact [26]. Update Power-Interest grids to reflect changes in stakeholder influence and interest levels [27]. Additionally, assess workshop success by tracking the number of key themes, pain points, and follow-up actions identified during synthesis sessions [28].
For example, Deutsche Bank replaced static PDF reports with Power BI dashboards, leading to 89% of board members rating the data as "highly trustworthy", up from 54%. This shift sped up approval cycles significantly [26].
To improve accessibility, use redundant encoding - don’t rely solely on color to convey meaning. Add symbols like arrows (↑/↓) or plus/minus signs to make data interpretable for color-blind users. Ensure a minimum 4.5:1 color contrast ratio to enhance readability for all stakeholders [26].
Adapting Visual Tools for Tech Leaders
Engineering leaders face a unique challenge: while 95% of organizations struggle with adopting AI effectively, 78% still implement it in some form [30][32]. Visual tools are proving to be a game-changer, turning abstract AI strategies into concrete action plans. Since over 50% of the brain's cortex is dedicated to visual processing, these tools simplify the complexities of AI for technical teams [30]. With this foundation, let’s explore how tech leaders can transform abstract strategies into practical steps.
Leadership Applications of Visual Tools
AI-powered visual tools offer engineering leaders a way to instantly create structured frameworks. For instance, platforms like Miro AI can generate RACI matrices from project descriptions, clarifying roles at the start of a project, or draft OKR plans from high-level goals, speeding up quarterly planning [32].
"This was the most valuable exercise of the whole workshop; it aligned the overall and technical vision and revealed how many people were making assumptions about what's important or not when writing code" [33].
Anthony Mayer, VP of Engineering, shared this insight after using visual frameworks to align his team’s technical vision.
The Diamond Pattern is another effective method for leadership sessions. It breaks the process into four phases: Opening (setting context), Divergent (brainstorming ideas), Convergent (prioritizing them), and Closing (finalizing action items). By investing effort upfront in structured planning, leaders can avoid common execution pitfalls [4].
These applications of visual tools lay the groundwork for a more tailored approach to AI strategy planning.
Aligning Visual Tools with AI Strategy Planning
AI strategy workshops thrive with a structured approach like the Diverge-Converge-Narrow framework. Here’s how it works: start by using AI to generate a wide range of ideas, then have AI narrow them down based on criteria like feasibility and cost. Finally, bring the team together to cluster and prioritize the refined ideas [31]. Adding a few extra minutes for AI-assisted ideation allows participants to refine prompts and review outputs thoroughly [31].
Collaborative prompt creation is another key to success. Small groups of 2–4 participants can draft AI prompts together, ensuring high-quality outputs and better alignment before generating responses. Facilitators can then use AI to evaluate suggestions on feasibility, desirability, and viability, streamlining decision-making [31]. Even though two-thirds of knowledge workers see AI as beneficial, nearly half feel their companies lack a clear adoption plan - a gap visual tools can help address [32].
Using Tech Leaders Training for Workshop Success
Tech Leaders offers training programs designed to help engineering professionals use visual tools to improve stakeholder engagement and decision-making. These programs bridge technical expertise with essential non-technical skills, such as leadership and AI business strategy, enabling individuals to advance from technical roles to independent consulting.
Aligned leadership teams can significantly improve performance by focusing on people, alignment, and curiosity [30].
"Seeing is how teams cut through noise, make progress visible, and focus on what truly matters" [30].
Leigh-Margaret Stull from Mural highlights how visual facilitation helps teams shift from relying on a single authoritative voice to exploring diverse, AI-generated possibilities. By mastering these techniques, tech leaders can seamlessly connect technical execution with strategic decision-making, turning visual inputs into actionable outputs during workshops. This approach empowers leaders to guide their teams toward clarity and alignment.
Conclusion
Key Takeaways
Visual tools can turn stakeholder workshops into dynamic sessions of active collaboration. Consider this: 73% of workshop failures stem from poor planning, and 75% of content is forgotten without proper documentation [4]. These numbers highlight the importance of visual frameworks - they produce tangible results like prioritized lists, decision logs, and prototypes that keep teams aligned long after the workshop ends.
Visual collaboration also addresses a major challenge: dysfunctional cross-functional teams [1]. Tools such as interactive whiteboards, stakeholder mapping, and AI-assisted frameworks help transform abstract ideas into actionable strategies. This process enables teams to move smoothly from brainstorming diverse ideas to making focused decisions.
"A well-planned workshop with average facilitation will outperform a poorly planned workshop with brilliant facilitation every time."
– Workshop Weaver [4]
This quote emphasizes the importance of preparation. Spending 80% of your effort on planning and only 20% on delivery ensures success. Visual frameworks play a key role in this preparation, creating a shared memory that extends well beyond the workshop [4][29]. The discussion on visual frameworks demonstrates how effective planning leads to results that last.
These insights offer a roadmap for transforming the way workshops are designed and executed.
Next Steps for Tech Leaders
Building on these takeaways, focus on meticulous planning rather than just delivery. Choose the right visual frameworks, set clear objectives, and prepare participants for digital collaboration. To reinforce the workshop's impact, share a consolidated document of outputs, decisions, and next steps within 72 hours [4].
For those looking to refine their approach, Tech Leaders provides engineering leadership training tailored to technical professionals. Their programs combine technical expertise with leadership skills and AI business strategy. By mastering visual tools, you'll turn presentations into interactive, results-oriented collaborations that drive strategic decision-making and stakeholder engagement.
FAQs
How do I pick the right visual tool for my workshop goal?
The tool you choose for your workshop should align with its purpose. For brainstorming or tackling problems, online whiteboards are excellent. They allow participants to collaborate in real time, making it easier to share ideas and build on each other’s input.
If your focus is on planning or creating structure, tools like templates or checklists can boost productivity and keep everyone on track. These are especially helpful for organizing tasks and ensuring clarity.
For remote workshops, platforms that include interactive features - such as breakout rooms, timers, and polls - can keep participants engaged and make the session more dynamic.
The key is to match the tool’s features with your workshop’s goals. Whether you’re aiming for creative ideation, structured planning, or seamless collaboration, the right tool can make all the difference.
What’s the fastest way to turn sticky-note ideas into clear decisions?
Using visual tools is one of the quickest ways to organize and prioritize effectively. Techniques like ranking, rating, and sorting simplify the process of narrowing down preferences. Pair these with structured facilitation methods - such as time-boxing, setting clear agendas, and engaging in interactive activities like voting or grouping similar ideas - to make priorities more apparent. These strategies not only make ideas more concrete but also encourage collaboration, which helps speed up decision-making.
How do I keep remote and in-room stakeholders equally engaged?
To ensure everyone - whether remote or in the room - feels involved, structured facilitation techniques are key. Start by setting clear objectives for the session and establishing accountability protocols so everyone knows their role and responsibilities. This approach helps create a space where all voices are heard and valued.
Incorporate interactive tools like breakout rooms, emoji reactions, and online whiteboards to keep participants engaged. These tools not only make collaboration easier but also add an element of fun and interactivity to the experience. However, it's important to prepare participants ahead of time by introducing them to these tools and explaining how they'll be used.
When organizing workshops, structure them thoughtfully with agendas, timers, and regular breaks. This keeps the session focused and ensures inclusivity, giving everyone the chance to contribute meaningfully without feeling overwhelmed.