
Ultimate Guide to Fairness Metrics in High-Stakes AI
AI systems in healthcare, criminal justice, and finance can unintentionally amplify inequities. For instance, a 2019 study revealed that a healthcare algorithm misclassified Black patients as healthier due to systemic disparities, reducing their access to critical care by 50%. Similarly, recidivism prediction tools in criminal justice often reflect biases in historical data, disproportionately impacting minority groups.
Key fairness metrics to address these issues include:
- Demographic Parity: Ensures equal selection rates across groups but doesn’t guarantee accuracy for each group.
- Equalized Odds: Balances true and false positive rates across demographics, useful in reducing service quality disparities.
- Equal Opportunity: Focuses on equalizing true positive rates, prioritizing fairness where missing qualified individuals is more harmful.
- Predictive Parity: Aligns risk scores with actual outcomes across groups but can conflict with other metrics.
Challenges include:
- Metrics often conflict (e.g., demographic parity vs. equalized odds).
- Bias in training data undermines fairness assessments.
- Balancing fairness with performance requires trade-offs.
Practical steps for leaders:
- Identify potential harms and impacted groups.
- Use fairness metrics to measure disparities.
- Leverage tools like Fairlearn and IBM AIF360 for analysis.
High-stakes AI demands careful alignment of metrics with domain-specific priorities, whether ensuring equitable healthcare access or reducing unjust criminal justice outcomes.
Understanding and Applying Fairness Metrics in AI
Core Fairness Metrics in AI
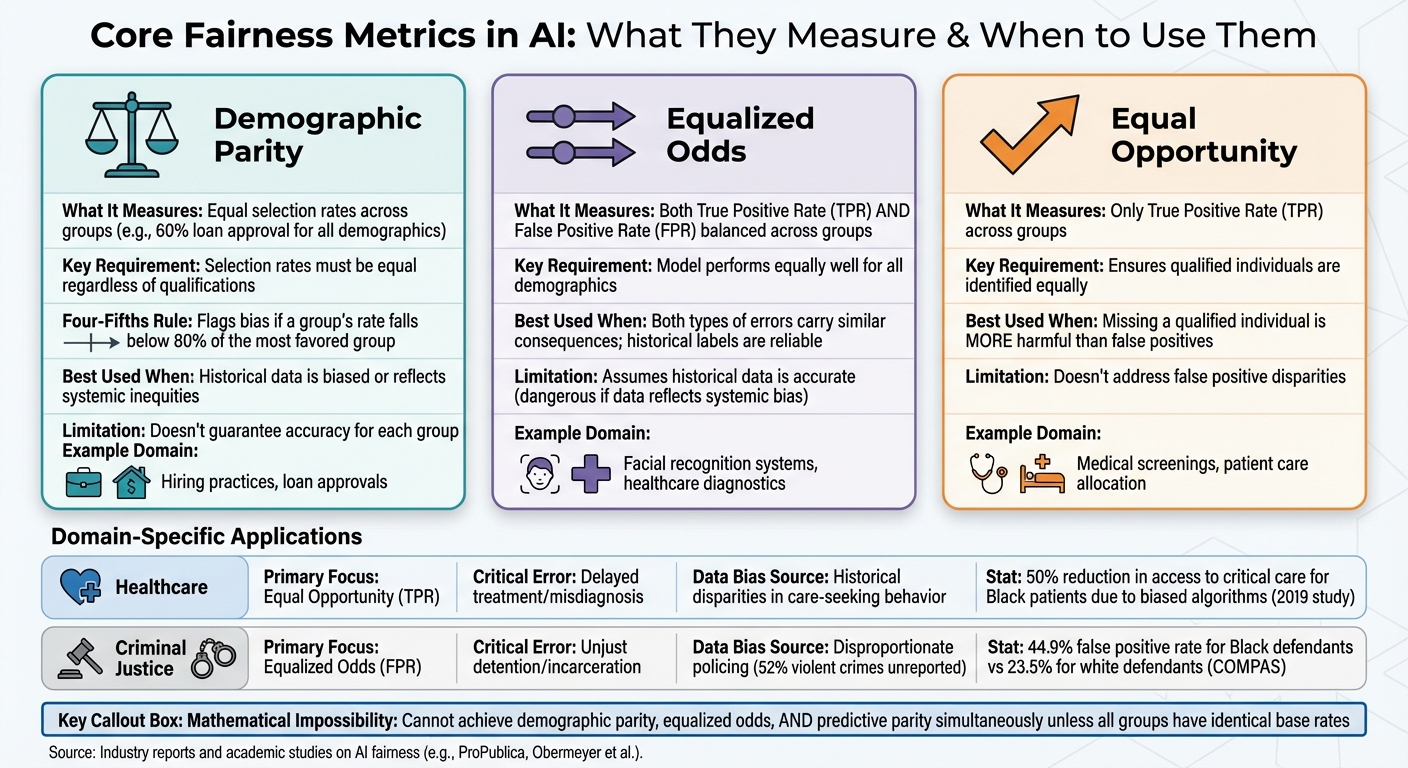
Core AI Fairness Metrics Comparison: Demographic Parity vs Equalized Odds vs Equal Opportunity
Fairness metrics help measure how an AI system treats different demographic groups, offering various ways to define fairness depending on the context and values at play.
Demographic Parity
Demographic parity aims to ensure that a model's predictions don't depend on sensitive group membership. For binary classification tasks, this means that selection rates - such as loan approvals - are the same across all groups, regardless of their actual qualifications[4][5].
For instance, if an AI system approves loans at a 60% rate for one demographic group, demographic parity requires a similar approval rate for all groups. The Four-Fifths Rule (80% Rule), rooted in U.S. federal employment law, flags potential bias if a group's selection rate falls below 80% of the most favored group's rate[4][5].
This metric is particularly useful when historical data is biased or reflects inequities. However, it has its flaws. As highlighted in Fairness and Machine Learning:
"Imagine a company that in group A hires diligently selected applicants at some rate p > 0. In group B, the company hires carelessly selected applicants at the same rate p. Even though the acceptance rates in both groups are identical... it will appear in hindsight that members of group B performed worse."[4]
In healthcare, demographic parity might be applied to ensure that mortality predictions are made at the same rate for males and females. However, this doesn't guarantee that the predictions are accurate for each group, raising questions about its practical utility.
Next, let's explore fairness metrics that focus on balancing error rates across groups.
Equalized Odds and Equal Opportunity
Equalized odds requires a model to perform equally well across all groups by ensuring that both true positive rates (TPR) and false positive rates (FPR) are balanced[4][6]. This metric is especially helpful for addressing quality-of-service issues, such as when facial recognition systems show varying error rates for different ethnic groups[1].
In healthcare, equalized odds could ensure that false negative rates - like missed diagnoses - are consistent across demographic groups, reducing delays in critical treatments.
Equal opportunity, a simpler version of equalized odds, focuses solely on equalizing true positive rates across groups[4][5]. This is particularly relevant in scenarios where missing a qualified individual, such as a patient in need of care, is more harmful than making a false positive error.
| Metric | What It Compares | Primary Use Case |
|---|---|---|
| Demographic Parity | Selection rates across groups | When historical data is biased or reflects inequities |
| Equalized Odds | True positive and false positive rates | When both types of errors carry similar consequences |
| Equal Opportunity | Only true positive rates | When missing qualified individuals is more harmful |
While these metrics address error balance, others, like predictive parity, focus on ensuring fairness in risk scores.
Predictive Parity
Predictive parity ensures that predictive accuracy - such as precision or positive predictive value - is consistent across all demographic groups[4]. This means that a high-risk score should reflect the same level of actual risk for everyone.
In healthcare, predictive parity could ensure that a patient's risk score for deterioration leads to ICU bed allocation based purely on medical need, without demographic bias. For example, if a model assigns a 70% readmission risk to patients in one group, that score should indicate the same likelihood for patients in any other group.
However, predictive parity often clashes with other fairness metrics. In fact, it's mathematically impossible to satisfy demographic parity, equalized odds, and predictive parity simultaneously unless all groups have identical base rates for the outcome[3]. This makes it essential to carefully choose a metric based on the specific values and goals of the system.
"Fairness must be assessed by examining the entire sociotechnical context of a machine learning system." – Fairlearn Documentation[4]
Ultimately, no single metric can capture every aspect of fairness. Each reflects different priorities and trade-offs, so selecting the right metric depends on the domain, the potential harms involved, and the stakeholders impacted by the AI system. In high-stakes areas, these decisions carry significant weight and demand careful consideration.
Challenges and Trade-offs in Fairness Metrics
Fairness metrics in high-stakes AI involve unavoidable conflicts. These metrics often oppose one another, meaning prioritizing one can come at the expense of another. For anyone developing or using AI in critical areas, understanding these trade-offs is crucial.
Conflicts Between Metrics
Fairness metrics often conflict at a fundamental level. For instance, achieving both demographic parity and equalized odds simultaneously is mathematically impossible unless all groups share the same base rates for the outcome[4][8]. This forces a decision: which fairness measure takes precedence?
Take demographic parity, which ensures equal selection rates across groups regardless of qualifications. On the other hand, equalized odds aims to balance true and false positive rates based on historical data. However, equalized odds assumes historical labels are accurate - a dangerous assumption if the data reflects systemic biases, such as over-policing in certain communities. In such cases, this metric risks perpetuating those injustices by treating biased labels as valid[4][5].
The Four-Fifths Rule, drawn from U.S. federal employment law, highlights yet another conflict. While useful in hiring practices, applying this rule in other contexts doesn't necessarily result in fairness.
These conflicts underline how fairness metrics are shaped by their context and the compromises they demand. Next, we'll explore how biases in data and algorithms further complicate fairness assessments.
Types of Bias and Their Impact
Bias in data and algorithms undermines fairness metrics in distinct ways. Historical bias arises when training data reflects past inequities, like biased arrest records or discriminatory lending. Measurement bias, on the other hand, occurs when the target variable fails to accurately represent the intended concept[4][1].
A classic example is Simpson's Paradox, which shows how aggregate fairness metrics can obscure subgroup disparities. The 1973 UC Berkeley admissions study found no overall bias but revealed significant disparities when the data was broken down by department[4].
Fairness measured at the population level can mask severe issues within specific subgroups. For example, a model might seem fair overall but exhibit significant bias against groups like Black women or non-binary individuals[1]. The multiple comparisons problem adds another layer of difficulty: as groups are divided into smaller categories, the likelihood of at least one subgroup failing a fairness metric increases due to random chance rather than actual bias[4][5].
These challenges set the stage for the next critical issue: balancing fairness with performance.
Balancing Fairness and Performance
Building on the conflicts and biases discussed, striking a balance between fairness and performance introduces further challenges.
Fairness constraints can reduce overall model performance, creating trade-offs between predictive accuracy and equitable error distribution. Research has shown that imposing formal fairness requirements can sometimes result in policies that are worse for both fairness and performance compared to strategies tailored to specific goals[7]. In healthcare, this trade-off becomes especially stark: should demographic parity be prioritized at the cost of predictive accuracy, or should clinical effectiveness take precedence even if it leads to unequal error rates?
At Stanford Health Care, researchers evaluated AI models using a multi-dimensional framework that considered fairness, usefulness, and reliability. Out of six AI-driven solutions, only two were implemented following this rigorous review[9]. This underscores the reality that balancing fairness with performance often requires rejecting models that might otherwise be chosen based solely on accuracy.
The tension between allocation harms and quality-of-service harms adds yet another layer of complexity. A model might achieve equal selection rates (addressing allocation harms) but have higher error rates for certain minority groups (causing quality-of-service harms)[1][4]. Optimizing for one often comes at the expense of the other, leaving decision-makers to determine which harm is more critical to address in their specific application.
sbb-itb-8feac72
Fairness Evaluation in High-Stakes Domains
Let’s take a closer look at how fairness metrics play out in two critical areas: healthcare and criminal justice. These fields bring the theoretical challenges of fairness into sharp focus, as the systems involved have direct and profound effects on people's lives. Each domain comes with its own set of hurdles when it comes to measuring and implementing fairness.
Healthcare Applications
AI in healthcare faces fairness issues tied to the way medical data is gathered and its inherent limitations. Common metrics like demographic parity, equalized odds, and equal opportunity are applied in clinical settings, but their use often exposes deeper, domain-specific problems.
For instance, diagnostic tools often aim for equalized odds, ensuring balance in true and false positive rates across different groups to minimize disparities in service quality[4][1]. However, the concept of biased ground truth complicates this effort. The clinical labels used to train these models frequently reflect existing biases in healthcare or historical inequities. As a result, the "correct" outcomes these tools learn may already be flawed[10][11].
Take melanoma detection AI as an example. Models trained mainly on the Melanoma Project dataset - dominated by images of light-skinned patients from the U.S., Europe, and Australia - showed poorer performance at identifying lesions on darker skin tones. This gap could delay critical diagnoses for underrepresented populations[10].
"For many diagnostic and prognostic clinical applications, the 'ground truth' used for fairness assessment metrics may already be embedded with biases and laced with suboptimal outcomes that are not explained by clinical features."
- Amarachi B. Mbakwe, Department of Computer Science, Virginia Tech[11]
Another issue is non-randomly missing data. Patients with lower socioeconomic status often have fragmented medical records, leading AI systems to underestimate their health risks[10]. A November 2024 study on an AI model trained with the MIMIC-III dataset revealed that this imbalance could result in recall rates for minority groups dropping as low as 25%. Such disparities could lead to inequitable medical interventions if these models are deployed[10].
Medical imaging AI adds yet another layer of complexity. These systems can detect features like race or sex from X-rays - traits that aren’t clinically relevant to the diagnosis. This capability, which even human experts lack, allows models to rely on "shortcut features" instead of genuine clinical indicators[11]. Compounding the problem, over half of published clinical AI models are trained on datasets from just two countries - the U.S. and China - limiting their usability across diverse populations[10].
While healthcare struggles with biases in clinical data and representation, criminal justice faces similar hurdles rooted in biased policing data.
Criminal Justice Applications
In criminal justice, fairness challenges often arise because training data reflects policing patterns rather than actual behavior. For example, in the U.S., around 52% of violent crime victimizations and 60% of household property crimes go unreported to the police[12].
One well-known case is the 2016 ProPublica analysis of the COMPAS tool, which is used to predict recidivism in Broward County, Florida. The analysis found that the algorithm’s false positive rate for Black defendants was 44.9%, nearly double the 23.5% rate for white defendants. This meant Black defendants were disproportionately flagged as high-risk for reoffending, while white defendants were more often misclassified as low-risk[12][4].
This example highlights the inherent conflict between predictive parity and balanced error rates. When recidivism rates differ between groups - largely due to disparities in policing - it becomes mathematically impossible to achieve both predictive parity (calibration) and equalized false positive rates simultaneously[12][4].
"As long as the training data show higher arrest rates among minorities, statistically accurate scores must of mathematical necessity have a higher false positive rate for minorities."
- Partnership on AI Staff[12]
The 2016 Wisconsin v. Loomis case set an important precedent. The Wisconsin Supreme Court ruled that while COMPAS scores could inform sentencing, the Presentence Investigation Report must include warnings about the tool’s proprietary nature and the potential for biased classifications of minority offenders[12].
Criminal justice systems often prioritize false positive rates because the consequences - unjust detention or incarceration - are particularly severe. In contrast, healthcare systems focus more on equal opportunity, ensuring that qualified patients receive necessary treatments. The table below outlines these domain-specific priorities:
| Domain | Primary Metric Focus | Critical Error Type | Data Bias Source |
|---|---|---|---|
| Healthcare | Equal Opportunity (TPR) | Delayed treatment or misdiagnosis | Historical disparities in care-seeking behavior |
| Criminal Justice | Equalized Odds (FPR) | Unjust detention or incarceration | Disproportionate policing and reporting rates |
Both domains struggle with the use of proxy variables that encode systemic biases. In healthcare, proxies like "cost" or "utilization" often stand in for "health need", disadvantaging poorer populations who spend less on care despite having greater needs[13]. Similarly, criminal justice systems use "arrest" as a proxy for "crime", which reflects policing practices rather than actual criminal activity[12]. These challenges highlight the trade-offs inherent in relying on proxies - fairness metrics can expose these compromises but cannot entirely resolve them.
Implementing Fairness Metrics for Tech Leaders
Turning fairness metrics from theory into practice requires a structured approach. For technical leaders managing or developing AI systems in critical areas, the challenge extends beyond choosing the right metrics. It’s about embedding fairness assessments into both the development workflow and the broader organizational mindset.
3-Step Fairness Assessment Process
A fairness assessment can be broken into three clear steps, adaptable to various contexts.
- Identify Potential Harms: Begin by understanding the types of harm your system could cause. Allocation harms occur when opportunities or resources are unfairly withheld, while quality-of-service harms arise from performance disparities between groups[1].
- Focus on Impacted Groups: Pinpoint which groups might face these harms. Pay special attention to intersectional identities, such as Black women or Latinx nonbinary individuals, as these groups often experience unique challenges[1].
- Measure and Compare: Use specific metrics like demographic parity, equalized odds, or equal opportunity to quantify the harms. Then, compare these metrics across different groups to spot disparities[1].
"The goal of fairness assessment is to answer the question: Which groups of people may be disproportionately negatively impacted by an AI system and in what ways?"
- Fairlearn Documentation[1]
To uncover hidden disparities, evaluate your model on specific slices of data, such as error rates across ethnicities or age groups. Additionally, ensure that the variables or proxies your model relies on truly reflect the intended phenomena - this is especially crucial in areas like healthcare or hiring, where biased data is common[1]. Keep an eye out for statistical pitfalls like Simpson’s Paradox, where trends might reverse when data is aggregated or further broken down[4].
Tools and Resources for Fairness Analysis
Several open-source tools can help leaders implement fairness assessments effectively:
- Fairlearn: A Python package offering tools like MetricFrame to disaggregate metrics, along with functions such as demographic_parity_difference[1][14].
- IBM AI Fairness 360 (AIF360): A toolkit with an extensive range of metrics and algorithms to address bias in datasets and models[2].
- Responsible AI Toolbox: Provides dashboards and model comparison features to visualize fairness disparities across demographic groups[14].
Choosing the right metric depends on the harm you're addressing. For example:
- Use demographic parity if historical biases in the input data should not carry forward.
- Opt for equalized odds when historical labels are reliable, and you need consistent true positive and false positive rates across groups.
- Select equal opportunity when the cost of missing a true positive (e.g., a qualified loan applicant) outweighs the harm of a false positive[4].
It’s also important to avoid misapplying metrics like the Four-Fifths Rule, which was designed for specific legal contexts and may not suit broader applications[4][5].
These tools and strategies provide the foundation for turning fairness metrics into actionable plans, equipping leaders to guide fair AI initiatives.
How Leaders Drive Fair AI
Fairness in AI isn’t just a technical exercise - it’s a continuous commitment that spans the entire AI lifecycle. Leaders play a key role by fostering collaboration across teams and incorporating fairness at every stage. This means working with domain experts, ethicists, and impacted communities to fully understand the sociotechnical landscape of your system. As the Fairlearn project puts it, "Fairness of AI systems is about more than simply running lines of code. In each use case, both societal and technical aspects shape who might be harmed by AI systems and how"[15].
Leaders should also monitor proxy variables regularly. For example, if "cost" is used as a proxy for "health need" in a healthcare model, periodic checks are necessary to ensure that the proxy remains valid[1]. Custom metrics, created with tools like make_derived_metric, can help align evaluations with the specific social contexts of your system[1].
In high-stakes areas like healthcare or criminal justice, these leadership practices are crucial to deploying ethical AI. Fairness assessments must consider the entire sociotechnical system, starting with the real-world harms experienced by individuals and working back to the model itself[4]. For technical professionals stepping into leadership roles, developing skills like understanding social dynamics, building relationships with stakeholders, and driving organizational change is just as important as mastering fairness metrics.
Conclusion: Key Takeaways on Fairness Metrics
Summary of Core Metrics and Applications
When it comes to high-stakes AI systems, choosing the right fairness metrics is critical to addressing specific harms. For example, demographic parity focuses on ensuring equal outcome rates across different groups, while equal opportunity zeroes in on true positive rates, making it especially important in areas like medical screenings. On the other hand, equalized odds considers both true positive and false positive rates, a metric particularly relevant in criminal justice, where errors can disproportionately affect certain racial groups [16].
A review of 467 clinical AI studies revealed that group fairness dominates the field, being used in 93.1% of research, while individual fairness appears in just 4.3% [17]. Within healthcare, performance-based metrics, such as equal sensitivity, are applied in 79.5% of cases, reflecting the emphasis on diagnostic accuracy [17]. These numbers illustrate the current focus areas and priorities in clinical AI research.
These insights provide a foundation for tech leaders aiming to implement AI systems that are not just effective but also fair.
Final Thoughts for Tech Leaders
For tech leaders, these findings underscore the need to prioritize ethical AI practices.
"How we design, develop, and deploy AI today will determine who benefits tomorrow." - Kapor Foundation [18]
Fairness metrics are not a one-and-done task; they require ongoing attention and must extend beyond technical evaluations to include broader social and institutional considerations. Fairness is not static - what is considered fair in one context, such as mortgage lending, might differ significantly from fairness in allocating hospital resources [19].
To meet these challenges, tech leaders must become well-versed in fairness metrics and create organizational structures that support ethical AI development. This includes collaborating with domain experts, engaging with affected communities, and embedding fairness as a core principle. As regulatory pressures grow and frameworks for ethical AI become more established, the choice is clear: lead the way or risk falling behind.
FAQs
What’s the difference between demographic parity and equalized odds in AI fairness, and why do they conflict?
Demographic parity ensures that an AI model's positive prediction rate - essentially, the percentage of favorable outcomes - is the same across all protected groups, like race or gender, regardless of the actual differences in outcomes. For instance, if a model is used to approve loans, demographic parity would require that the approval rate is consistent across these groups.
Equalized odds, however, takes a different approach. It focuses on error rates, requiring that both true-positive and false-positive rates are the same for all groups. In simpler terms, the model’s accuracy shouldn’t vary based on group membership.
These two metrics often clash because they rely on different criteria. Demographic parity prioritizes equal selection rates, even if one group naturally has a higher rate of positive outcomes, which can skew true-positive or false-positive rates. On the flip side, equalized odds aims to balance error rates, but this can lead to unequal selection rates when groups have different baseline rates. Deciding between these metrics often boils down to the ethical priorities and practical goals of the AI application, as achieving both at the same time is typically not feasible.
What makes it challenging to balance fairness and performance in high-stakes AI systems?
Balancing fairness and performance in high-stakes AI systems - like those used in healthcare or criminal justice - is no easy task. One of the biggest hurdles is that fairness itself can be tough to pin down. Definitions of fairness are often uncertain or even subjective, which makes it challenging to ensure equity without affecting accuracy. On top of that, introducing fairness constraints into a model can sometimes weaken its predictive ability, creating a fairness-performance trade-off that’s tricky to navigate.
Then there are the practical obstacles: biased training data, a lack of transparency, and regulatory uncertainties all add layers of complexity. In critical areas like healthcare, where even minor drops in accuracy could directly impact patient safety, these challenges carry serious weight. Organizations also have to carefully balance fairness with reliability to maintain public trust - sacrificing one can risk the system’s overall credibility.
What steps can tech leaders take to ensure fairness in AI systems for critical applications?
To build trustworthy AI systems in critical areas like healthcare, criminal justice, or finance, fairness needs to be a priority from the very beginning. This means identifying potential risks, such as biases in resource allocation or differences in service quality, and understanding how they could impact protected groups like those defined by race, gender, or age. By using fairness metrics, you can measure and compare the effects on these groups, highlighting any disparities that need to be addressed.
The choice of fairness metrics should fit the situation. For instance, demographic parity ensures equal selection rates across groups, while equalized odds focuses on balancing false-positive and false-negative rates. Open-source tools, including fairness-focused libraries, can simplify the process of calculating these metrics and embedding them into workflows. Incorporating fairness checks at every stage - data collection, model training, validation, and post-deployment monitoring - helps ensure long-term accountability.
Leadership is key to driving fairness. Continuous education and governance measures, such as audit trails and fairness dashboards, are crucial for maintaining transparency. Programs like those offered by Tech Leaders empower senior professionals to advocate for fairness, set clear standards, and turn fairness metrics into actionable strategies. This not only supports responsible AI practices but also strengthens public confidence in these systems.