

How to Identify Key Data Sources for Change
Driving change without data is like navigating blindfolded - you risk going off course. Organizations that use data to guide change are 78% more likely to achieve their goals, yet fewer than one-third operate as data-driven today. Why? Challenges like data silos, manual processes, and low data literacy often get in the way.
To succeed, you need to:
- Define clear objectives: Align data needs with specific goals like boosting efficiency, cutting costs, or improving employee engagement.
- Identify data sources: Use internal metrics (e.g., system usage, employee feedback) and external benchmarks (e.g., industry trends, customer sentiment).
- Evaluate data quality: Focus on accuracy, completeness, and timeliness to ensure reliability.
- Prioritize actionable insights: Track 8–15 key metrics to avoid data overload and guide decisions effectively.
Organizations lose billions annually to poor data quality, so having a clear plan for collection and analysis is critical. Start by pinpointing your goals, selecting reliable data sources, and leveraging tools that automate insights.
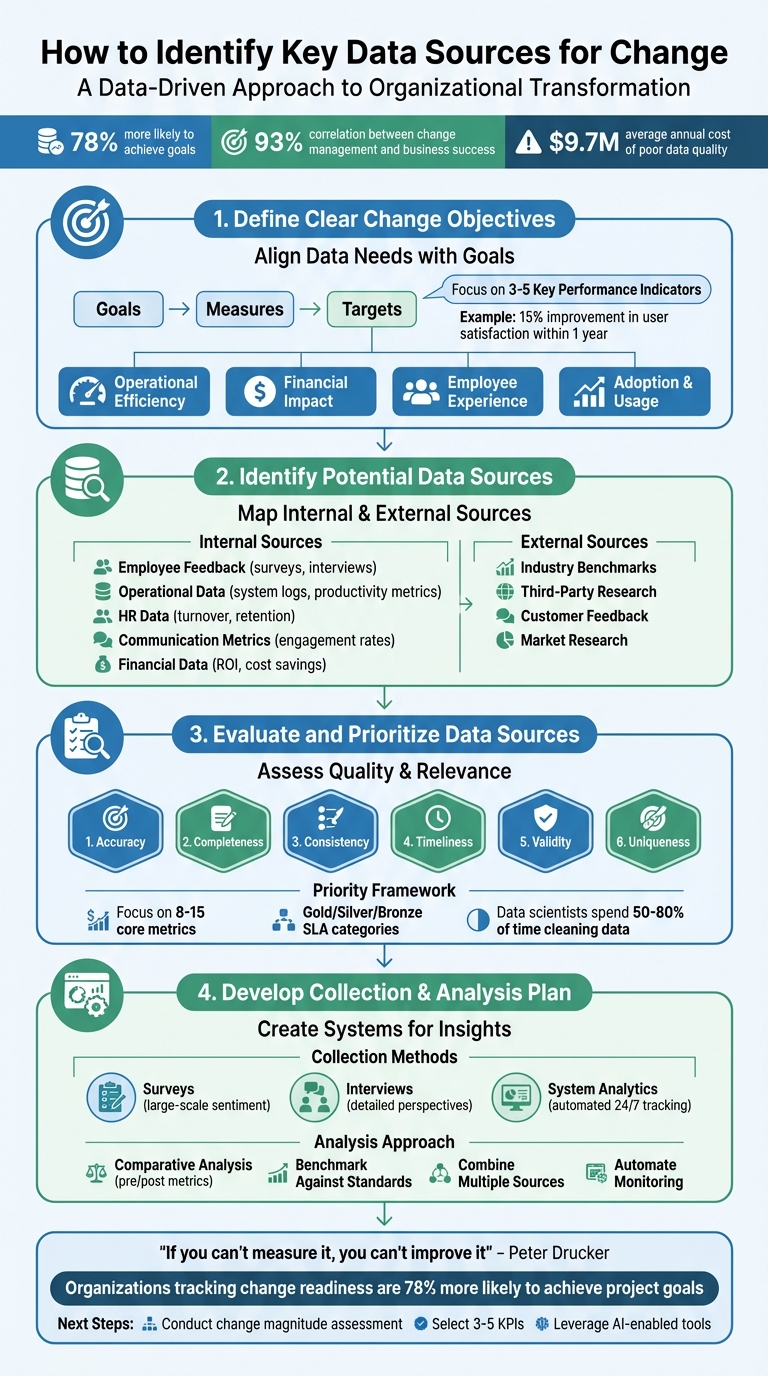
4-Step Framework for Identifying Key Data Sources for Organizational Change
Step 1: Define Clear Change Objectives
Align Data Needs with Organizational Goals
To pinpoint the right data sources, you first need to clarify what you want to achieve. Start by drafting specific "goal statements" that outline your desired outcomes - whether that's boosting quality, streamlining workflows, or enhancing employee engagement [6]. Having clear goals ensures you don’t waste time collecting irrelevant data.
A helpful way to approach this is by breaking it down into three parts: goals (what you aim to achieve), measures (how you’ll track progress), and targets (specific benchmarks with deadlines) [6]. For instance, if your goal is "better communication quality", you might measure it through "user satisfaction" and set a target of a 15% improvement within a year [6]. This structure helps you stay focused and prevents data overload.
Here’s an insight to consider: organizations that measure change readiness and adoption rates are 78% more likely to achieve their project goals. Plus, there’s a 93% correlation between strong change management practices and successfully meeting business objectives [2][5]. To stay on track, focus on identifying three to five Key Performance Indicators (KPIs) that align directly with your change management goals [1]. Too many KPIs can overwhelm you, while too few might leave you missing critical insights.
Once your objectives are clear, you can start exploring what kind of data aligns with typical change goals.
Examples of Common Change Objectives
Let’s look at how this framework applies to some common change objectives: completion (finishing the project on time), achievement (hitting desired outcomes), and acceptability (ensuring the change is embraced within the organization) [6]. Each of these demands different types of data.
- Operational efficiency objectives: Track metrics like transaction speed, process efficiency, or error rates [2][7].
- Financial impact objectives: Focus on data related to cost reductions, revenue growth, or ROI [2][1].
- Employee experience objectives: Measure factors like turnover rates, engagement scores, or burnout levels [3][1].
- Adoption and usage objectives: Monitor indicators such as system usage rates, training completion rates, or feature adoption frequency [3][2].
sbb-itb-8feac72
Change Analytics: Your Plan for Success
Step 2: Identify Potential Data Sources
Once your objectives are clear, the next step is to pinpoint where to find the data you need. This involves mapping out both internal and external sources of information. Start by categorizing these sources - internal versus external, quantitative versus qualitative, and by organizational level. Before diving into new data collection, check if existing resources like legacy reports, automated dashboards, or financial statements already hold the insights you're after [6].
Internal Data Sources
Your organization likely has a treasure trove of data waiting to be tapped. For example, employee feedback can reveal critical insights. Tools like change readiness surveys, training evaluations, and culture assessments can highlight early signs of resistance or morale shifts [2]. For deeper context, interviews and focus groups can provide qualitative perspectives [4].
Operational data is another powerful tool. Metrics like system usage logs show whether employees are adopting new tools, while productivity indicators - such as transaction speeds or error rates - can measure efficiency before and after changes are implemented [2][1]. Modern workforce analytics platforms take this a step further by offering real-time insights into team collaboration and burnout risks, reducing the need for manual surveys [1][3]. Meanwhile, HR data, including turnover rates, retention statistics, and employee mobility patterns, can reveal how organizational changes impact your workforce [1][4].
Communication metrics also play a key role. By tracking engagement with internal announcements - like hit rates, page views, and readership levels - you can gauge whether your messages are reaching employees effectively [2]. And, of course, financial data such as cost savings, revenue growth, and ROI reports provide the hard evidence that leadership often prioritizes [2][1].
While internal data paints a picture of your organization’s current state, external sources help you see the bigger picture.
External Data Sources
External data adds context and allows you to benchmark your progress against industry standards. For instance, industry benchmarks can show whether your performance aligns with broader trends. A current example includes behavioral data from over 1,100 companies, which is being used to establish AI adoption benchmarks for 2026 [1]. This kind of data helps you determine if a productivity dip is unique to your organization or part of a wider trend.
Additionally, third-party research can strengthen your case when presenting to decision-makers. External statistics, like the fact that transformation initiatives are six times more likely to succeed when paired with effective change management, can add credibility to your strategy [5]. Customer feedback, social media sentiment, and commissioned studies provide perspectives that internal data alone can’t offer [8][4]. Finally, market research on emerging technologies can help you anticipate future changes and better prepare your workforce [1].
Step 3: Evaluate and Prioritize Data Sources
Once you've outlined your change objectives, it's time to assess your data sources for both relevance and reliability. This step ensures that the data you rely on aligns closely with your goals. Selecting the right data sources is absolutely crucial. Consider this: Gartner reports that poor data quality costs organizations an average of $9.7 million annually, while in the United States, businesses collectively lose about $3.1 trillion every year due to bad data [9]. With stakes this high, having a clear plan to evaluate and prioritize your data sources is non-negotiable.
Criteria for Evaluating Data Sources
Your data needs to be reliable and tailored to your specific needs. While there are ten dimensions of data quality, focusing on six key criteria - accuracy, completeness, consistency, timeliness, validity, and uniqueness - can provide a practical framework for evaluation [9][10].
Here’s why this matters: Data scientists often spend 50%–80% of their time cleaning and organizing data. High-quality data can significantly reduce this time burden [9]. For instance, tools like RegEx can help automatically validate data formats, such as ensuring date strings or ID patterns are correct [9][10]. You might also check whether revenue figures align with your billing system within acceptable margins or confirm that employee IDs have a non-null rate of at least 99.9% [11].
To make this process actionable, assign a level of importance to each quality dimension based on how it impacts your change objectives. For example, if you're tracking how quickly employees adopt a new system, timeliness might outweigh precision. Document baseline scores for each criterion to track improvements over time. Additionally, categorize data sources by strictness levels - such as Gold, Silver, or Bronze Service Level Agreements (SLAs) - to reflect their importance in decision-making [11].
How to Prioritize Data Sources
Once you've evaluated the quality of your data, the next step is to focus on sources that align most closely with your strategic goals. A good starting point is to zero in on 8–15 core metrics that directly support your objectives [2]. Research shows that organizations tracking metrics like change readiness and adoption rates are 78% more likely to achieve their project goals [2]. This highlights the importance of prioritizing data that offers predictive insights over purely historical data.
Conduct a cost-benefit analysis to weigh the expense of extracting data against its potential impact on decision-making [8]. Begin with secondary data, such as internal records or industry benchmarks, as these are often more cost-effective. Reserve primary data collection - like custom surveys - for when it’s absolutely necessary [4][8]. To save time, focus on data sources that can be monitored with automated tools, reducing the need for manual intervention [9].
Be cautious with subjective sources that might introduce bias [2]. Instead, prioritize data that combines behavioral observations with quantitative surveys for a more accurate picture [2]. And don’t forget compliance - ensure any external data sources adhere to regulations like GDPR and CCPA [12][8].
Step 4: Develop a Data Collection and Analysis Plan
Once you've identified and prioritized your data sources, the next step is crafting a plan to collect and analyze that data effectively. As Jeffrey Richman from Estuary explains:
"Without reliable data collection, organizations risk building on assumptions rather than evidence" [15].
The goal is to create a system that gathers the right data at the right time while ensuring its accuracy and reliability.
Define a Collection Strategy
Start by pinpointing the key metrics you need to track [13]. This involves balancing quantitative data - like system usage rates and productivity metrics - with qualitative data, such as employee feedback collected through interviews or open-ended surveys [13]. Together, these approaches provide a fuller view, addressing both the "what" and the "why" behind your change initiative.
Your choice of collection methods should align with your objectives:
- Surveys and questionnaires: Ideal for collecting large-scale data while maintaining anonymity, making them great for gauging sentiment across teams [4][13].
- Interviews: Best for gathering detailed, nuanced perspectives [4].
- System analytics: Provides automated, 24/7 tracking of how employees interact with new software or processes, offering objective insights [2][13].
Before rolling out your data collection tools on a large scale, conduct a pilot test with a small group. This helps identify any confusing language or technical issues early on [4]. Additionally, prioritize existing internal data - such as performance metrics, turnover rates, or financial statements - before launching new data collection efforts. This approach saves time and resources while establishing a reliable baseline [4].
To ensure smooth execution, assign specific responsibilities for capturing, formatting, and analyzing data [6]. This accountability is essential for securing the baseline data you'll need for meaningful comparisons later.
Once your collection methods are in place, focus on analyzing the data in a way that drives clear, actionable insights.
Analyze Data for Actionable Insights
After gathering your data, the next step is turning it into insights that can guide decision-making. Comparative analysis is especially useful here - measuring pre- and post-change metrics can reveal the direct impact of your initiatives [4]. For instance, tracking employee performance scores or customer satisfaction ratings before and after implementing a new process can help determine if your efforts are working. Benchmarking against industry standards adds another layer of context, showing whether your progress measures up or if adjustments are necessary [4].
Change Data Capture tools can also provide near-instant visibility into system performance, allowing for quick operational tweaks when problems arise [15]. To strengthen your findings, combine insights from multiple data sources [14]. As Lashell Thomas aptly describes:
"Data collection is like building a puzzle where each piece helps complete the bigger picture of your area of interest" [13].
To maintain consistency across your analysis, use schema enforcement to prevent data drift [15].
Finally, embed data monitoring into your regular meetings rather than treating it as a separate task [6]. This approach ensures ongoing data quality and helps identify issues early. As Wendy Hirsch, a change management consultant, points out:
"Research indicates it's as important to overall performance as setting goals in the first place" [6].
Conclusion
Key Takeaways
Driving meaningful change starts with focusing on the right data - not every piece of information, but the data that aligns with clear goals and delivers measurable impact. Organizations that prioritize tracking change readiness and adoption rates are 78% more likely to meet their project objectives, and there’s a 93% correlation between effective change management and achieving business goals [2][16]. To capture the full picture of change, integrate diverse data types and automate collection processes whenever possible. As Peter Drucker famously said:
"If you can't measure it you can't improve it" [2].
This approach underscores the importance of aligning clear objectives, collecting high-quality data, and using insights to drive continuous improvement.
Next Steps for Leaders
Start your next initiative by conducting a change magnitude assessment. Identify what’s changing, the scale of the impact, and who will be affected [16]. Then, zero in on 3–5 key performance indicators that directly align with your objectives. This keeps the focus sharp and avoids drowning in unnecessary data [1].
Leverage AI-enabled tools instead of manual spreadsheets to gain real-time insights and reduce the risk of subjective bias [16]. While 83% of CEOs aim to lead data-driven organizations, only 25% of companies have achieved this goal [16]. For forward-thinking leaders, this gap represents a prime opportunity to stand out.
For technical professionals moving into leadership roles, combining analytical expertise with strategic vision is essential. Programs like those offered by Tech Leaders provide training in leadership and AI business strategy, bridging the gap between technical knowledge and the broader skills needed to thrive in today’s AI-driven world. By following these steps, you’ll be well-positioned to lead your organization through data-driven change effectively.
FAQs
What are the best first data sources to check before collecting new data?
When starting your research, it's smart to dive into secondary data sources first. These include internal records like performance reports, financial statements, employee feedback, and operational logs. They’re a cost-efficient way to gain insights into how your organization is performing. Beyond that, external reports and summaries can provide a broader perspective, helping you identify key trends and ensure any new data you gather is both accurate and aligned with your objectives.
How do I decide which KPIs matter most for my change initiative?
To identify the right KPIs for your change initiative, prioritize metrics that directly reflect your goals and measure success effectively. Consider focusing on these key areas:
- Adoption and engagement: Keep an eye on adoption rates, employee participation levels, and any signs of resistance within the team. These metrics can reveal how well the change is being embraced.
- Tangible outcomes: Evaluate measurable results like productivity improvements, operational efficiency, or return on investment (ROI). These figures show the impact of the initiative in concrete terms.
Choose KPIs that are specific, measurable, and closely tied to your objectives. This approach ensures you gain meaningful insights into your progress and overall success.
How can I validate data quality fast without a big analytics team?
To check data quality efficiently without relying on a big team, leverage automated validation techniques. Start by concentrating on critical metrics such as accuracy, completeness, consistency, and timeliness. Real-time monitoring tools can be especially useful for spotting anomalies or mismatches in schemas as they happen.
Make sure to define clear data ownership and set up targeted monitoring metrics to quickly pinpoint and address any problems. By combining automation with a focus on these key areas, you can validate data effectively while keeping resource use to a minimum.