

Liquidity Ratios: Importance for Business Leaders
Liquidity ratios measure a company's ability to meet short-term obligations using its most liquid assets. These ratios are critical for managing cash flow, securing financing, and making informed decisions about investments and operations. The three primary liquidity ratios are:
- Current Ratio: Measures all current assets against current liabilities. A ratio between 1.5 and 3.0 is generally healthy, depending on the industry.
- Quick Ratio: Excludes inventory for a sharper focus on liquid assets. A ratio of 1.0 or higher indicates a company can meet immediate obligations without relying on inventory sales.
- Cash Ratio: Focuses solely on cash and cash equivalents, providing a "worst-case" assessment of liquidity.
Understanding and tracking these ratios helps businesses avoid cash flow issues, maintain stakeholder confidence, and balance liquidity with profitability. While valuable, these ratios should be used alongside other financial metrics for a complete picture of financial health.
3 Liquidity Ratios You Should Know
The 3 Main Liquidity Ratios: Formulas and Benchmarks
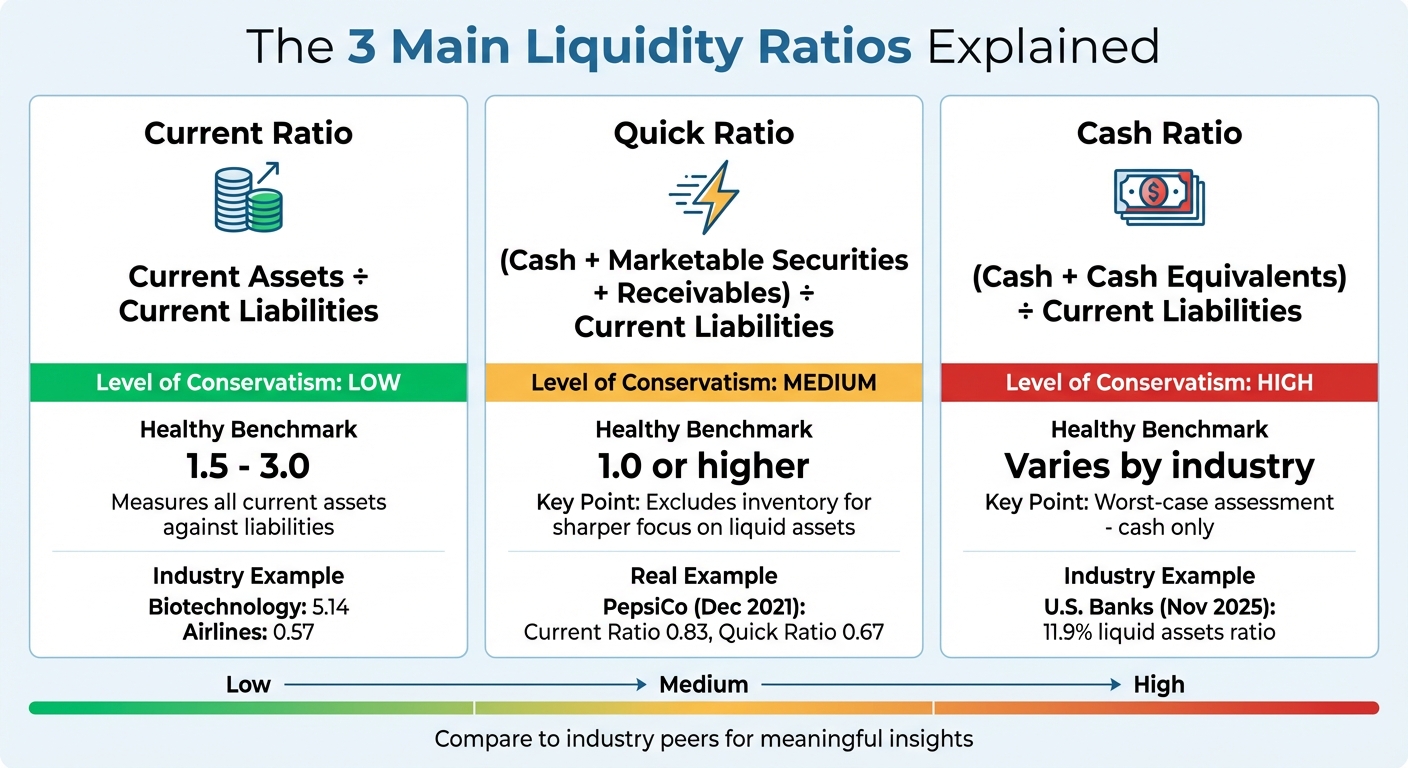
The 3 Main Liquidity Ratios: Formulas, Benchmarks, and Conservatism Levels
Current Ratio
The Current Ratio evaluates your company's ability to cover its current liabilities - debts due within a year - using all current assets, such as cash, accounts receivable, and inventory. The formula is simple: Current Assets / Current Liabilities [1][7].
For most U.S. companies, a current ratio between 1.5 and 3.0 is considered healthy, with 2.0 often cited as a common goal. However, the ideal range depends heavily on your industry [2][9][6]. For example, as of December 2025, the Biotechnology sector had an average current ratio of 5.14, while Airlines operated at just 0.57 [10]. This stark difference reflects unique industry needs - biotech firms require large cash reserves for lengthy R&D cycles, while airlines rely on predictable cash flows, allowing for lower ratios.
Retailers usually have ratios between 1.0 and 1.5 due to their fast-moving inventory, whereas technology companies often exceed 2.0, thanks to significant cash reserves [2]. The real insight comes from comparing your ratio to competitors in your specific industry rather than relying on a universal standard.
Quick Ratio
The Quick Ratio, or Acid-Test Ratio, takes a more cautious approach by excluding inventory and prepaid expenses from the equation. Its formula is: (Cash + Marketable Securities + Accounts Receivable) / Current Liabilities [1][7].
This measure focuses on assets that can quickly convert to cash, making it a reliable indicator of whether your business can meet short-term obligations without relying on inventory sales. A quick ratio of 1.0 or higher generally signals that your company can handle immediate debts without liquidating stock [2].
Inventory is excluded because converting it to cash can take time, especially if it includes slow-moving or outdated products [9]. For example, in December 2021, PepsiCo Inc. reported a current ratio of 0.83 but a quick ratio of just 0.67, highlighting how much of its liquidity was tied up in inventory [5]. If your current ratio looks strong but your quick ratio lags, it may indicate that too much capital is tied up in stock that isn't readily convertible to cash.
The Cash Ratio further refines liquidity analysis by focusing solely on cash and equivalents.
Cash Ratio
The Cash Ratio is the strictest liquidity measure, focusing exclusively on cash and cash equivalents. Its formula is: (Cash + Cash Equivalents) / Current Liabilities [2][7].
This ratio answers a "worst-case" question: could your company pay off all its current liabilities immediately if no receivables were collected and no inventory could be sold? A cash ratio of 1.0 means you have just enough cash on hand to cover all short-term debts [9].
Most businesses don't aim for a cash ratio of 1.0, but this metric is useful for stress-testing your financial health and gauging your immediate payment capacity. It's especially valuable during economic downturns or when negotiating with lenders who want reassurance of your ability to handle sudden financial challenges. For instance, as of November 2025, U.S. commercial banks maintained a liquid assets ratio of 11.9%, reflecting the sector's focus on cash reserves [11].
| Ratio | Formula | Level of Conservatism | Typical Healthy Benchmark |
|---|---|---|---|
| Current Ratio | Current Assets / Current Liabilities | Low | 1.5 – 3.0 [2] |
| Quick Ratio | (Cash + Marketable Securities + Receivables) / Current Liabilities | Medium | 1.0 or higher [2] |
| Cash Ratio | (Cash + Cash Equivalents) / Current Liabilities | High | Varies by industry |
What Research Shows About Liquidity Ratios and Business Performance
The Balance Between Liquidity and Profitability
Research highlights an age-old challenge for businesses: liquidity offers security, but it comes with trade-offs. Having cash on hand ensures you can weather short-term challenges, but it also means tying up funds that could be used to generate profits. For instance, instead of sitting in reserves, that capital could fuel growth initiatives, purchase new equipment, or fund other productive ventures [4][8].
Studies show that companies often hold cash as a safeguard against unexpected expenses or economic downturns. This helps ensure they can fund critical projects when external financing becomes tough or expensive [12]. While this approach acts as a safety net during uncertain times, it also means missing out on potential returns during more stable periods. Striking the right balance depends on factors like your industry, growth stage, and appetite for risk.
Understanding this balance is critical, especially when it comes to spotting early warning signs in your financial health.
Using Liquidity Ratios as Warning Signs
A drop in liquidity ratios can reveal operational inefficiencies - things like delayed payments, overstocked inventory, or poor cash management practices [1][3].
Take the 2007-2009 financial crisis as an example. The $2 trillion U.S. commercial paper market froze, leaving even solvent companies like General Motors in a liquidity crunch. Despite having assets, they couldn't convert them to cash quickly enough to meet their obligations [1]. This example underscores a key point: liquidity issues aren't just internal - they're often tied to external market conditions, which can leave even healthy businesses vulnerable.
For creditors and investors, liquidity ratios are a critical tool. They help differentiate between companies that use debt strategically and those at risk of bankruptcy due to an inability to cover short-term obligations [5]. When a company’s ratios drop below 1.0, it signals higher default risk, which can make financing more expensive or harder to secure.
Tracking Trends and Comparing to Industry Standards
Beyond short-term red flags, long-term trends can reveal deeper insights. Analyzing liquidity ratios over time - quarter by quarter or year by year - provides a clearer picture than a single data point. As Harvard Business School Professor Suraj Srinivasan explains:
"Overall, the insights gained from analyzing a company's historic performance provide the foundation for forecasting the company's future prospects" [7].
For example, a current ratio declining from 2.5 to 1.3 over six months paints a more concerning picture than just seeing the 1.3 figure in isolation.
Another layer of analysis comes from benchmarking against industry peers. A current ratio of 1.5 might be strong in retail but could raise concerns in the tech sector, where ratios between 2.0 and 3.0 are more common [13]. However, many business leaders lack the data to make these comparisons - only 44% of owners make fully informed financial decisions [3].
When benchmarking, it’s crucial to compare against companies of similar size and location. A regional manufacturer with $10 million in revenue can’t meaningfully compare itself to a global corporation. The best insights come from analyzing your own trends alongside direct competitors in your market [3].
These tools - tracking trends and benchmarking - are essential for making informed financial decisions that drive long-term success.
sbb-itb-8feac72
How Business Leaders Should Use Liquidity Ratios
Making Investment and Growth Decisions
Liquidity ratios can reveal whether your business is sitting on idle cash that could be used for investment or growth. For instance, if your cash ratio is well above 1.0, it suggests you have more cash than needed to cover immediate obligations - cash that could be working harder for you. Say the industry average cash ratio is 1.5, but yours is 2.0; this likely means you have excess funds available for strategic growth opportunities [9][14].
On the flip side, weak liquidity can hold your business back. It might force you to delay hiring or expansion plans. As Sean Beniston of BDC Advisory Services explains:
"At the end of the day, it takes money to make money. If you can't access working capital, how do you grow?" [14]
When working capital is tight, you may need to put off critical initiatives to avoid running into a cash crunch. The challenge lies in finding the right balance - maintaining enough cash for safety while reinvesting surplus funds to generate better returns. This approach not only boosts growth but also aligns with smarter working capital management.
Managing Working Capital and Operations
Think of liquidity ratios as your business's fuel gauge - they show whether you have enough cash to handle daily operations and short-term obligations. They can also highlight inefficiencies, like capital tied up in uncollected invoices or unsold inventory [3].
To free up cash, start by addressing Days Sales Outstanding (DSO). You could implement automated invoicing, offer discounts for early payments, or shorten credit terms to get paid faster [15]. Selling off excess inventory is another quick way to unlock working capital [3].
Restructuring debt can also improve your liquidity. For example, refinancing short-term debt into long-term loans reduces current liabilities, improving your ratios [15]. Tracking these metrics regularly - monthly or quarterly instead of annually - can help you identify issues like declining revenue or rising debt before they become major problems [14]. Proactive working capital management not only keeps your operations running smoothly but also strengthens your position when seeking external financing.
Securing Financing and Managing Stakeholder Relationships
Strong liquidity ratios play a key role in building trust with lenders and stakeholders. Financial institutions often rely on these metrics to assess your creditworthiness. Generally, a ratio of 1.0 or higher signals that your business can cover its immediate debts, which reassures lenders and boosts your chances of securing loans or credit [7][16]. As The BILL Team notes:
"A strong liquidity ratio can demonstrate to lenders and investors that your company is a worthwhile investment" [3].
However, too much liquidity can backfire. While stability is important, ratios that are excessively high - like 9.0 - might suggest inefficient use of capital. Investors typically want to see that your funds are actively contributing to growth rather than sitting idle:
"Investors want to see that you're using your capital wisely, so many will be put off by such high liquidity ratios [as 9.0]" [16].
Liquidity also impacts relationships beyond lenders. Suppliers, employees, and vendors look at these metrics to gauge your reliability. Healthy liquidity ensures you can meet obligations like payroll and supplier payments on time, reducing the risk of delivery delays or stricter payment terms [5][16]. Always compare your liquidity ratios to industry benchmarks, as the ideal range varies depending on your sector [5].
Limitations of Liquidity Ratios
Accounting Methods and Data Issues
Liquidity ratios can provide valuable insights, but they come with some limitations that are worth noting. These ratios often assume that all current assets can be converted to cash at their book value, which isn't always the case. For instance, accounts receivable might include debts that are unlikely to be collected, and inventory could contain outdated or unsellable items that might only move with heavy discounts [17][2]. Additionally, accounting methods can distort these figures. For example, companies using LIFO (Last In, First Out) versus FIFO (First In, First Out) for inventory valuation can report very different liquidity ratios, even if their actual operations are identical [17][7].
Another limitation is that these ratios offer a snapshot of a specific moment in time - like the balance sheet on December 31st - without capturing obligations that may arise right after the reporting period [17][2]. This can lead to "window dressing", where a company appears financially stable at the reporting date but is actually facing cash flow challenges. For example, a strong current ratio might hide timing issues, such as bills coming due before receivables are collected [2].
These factors highlight that liquidity ratios are just one piece of the financial puzzle and should be interpreted with care.
Why You Need More Than Just Liquidity Ratios
Liquidity ratios alone won't give you the full picture of a company's financial health. While they indicate whether a business can cover short-term obligations, they don't address long-term sustainability or profitability [2][5]. A company might look profitable on paper but still face liquidity issues if profits are tied up in uncollected receivables. On the other hand, excessively high liquidity ratios - such as those above 2.0 or 3.0 - could suggest that the company is holding too much idle cash rather than investing in opportunities for growth [2][4].
For a more complete analysis, it's essential to pair liquidity ratios with other metrics. Solvency measures like debt-to-equity and profitability indicators like return on assets can help paint a clearer picture of a company's overall financial health [2][5].
Reading Ratios in Context
Context is everything when interpreting liquidity ratios. For example, a current ratio of 0.83 might seem concerning at first glance. However, when PepsiCo reported this exact figure in December 2021, it was perfectly normal for the cash cycles typical of the large-scale beverage industry [5]. What's considered a healthy ratio can vary widely between industries. In retail, a current ratio of 1.0 to 1.5 might be standard, while in service industries, a ratio of 2.0 to 3.0 could be more appropriate [2].
It's also important to look at trends over time rather than focusing on a single data point. Tracking ratios quarterly or annually can help you identify patterns and anticipate potential issues [2][3]. A ratio that looks strong today might signal trouble later if your market position shifts [18]. To make informed decisions, combine ratio trends with real-time cash flow forecasts, especially if your business experiences seasonal fluctuations [2].
"Overall, the insights gained from analyzing a company's historic performance provide the foundation for forecasting the company's future prospects" [7].
Conclusion
Liquidity ratios provide a quick and clear snapshot of a business's ability to handle its short-term financial responsibilities. This insight helps leaders make informed decisions and manage finances more effectively, ensuring they can address immediate obligations without unnecessary strain [2][4].
Understanding these metrics is essential for business leaders, especially since many may not have a full grasp of their financial landscape. These ratios serve as an early warning system, flagging potential cash flow challenges. By identifying issues early, leaders can adjust operations, avoid financial pitfalls, and strengthen relationships with lenders, banks, and suppliers.
While valuable on their own, liquidity ratios are even more powerful when combined with other financial metrics. To get the most out of them, review these ratios quarterly, compare them to industry standards, and incorporate them into a broader financial strategy. Pairing liquidity analysis with cash flow forecasting and a deep understanding of your business model can help you better manage working capital, secure funding, and make smart decisions for long-term growth [3].
FAQs
Why are liquidity ratios important for securing business financing?
Liquidity ratios play an essential role in showing how well a company can handle its short-term financial responsibilities. When these ratios are higher, they send a clear message to lenders: the business is financially sound and well-equipped to pay off its debts on time.
This kind of financial stability boosts confidence among lenders and investors. It can lead to easier access to financing, better loan terms, and increased interest from potential investors. By keeping liquidity ratios strong, business leaders can present their companies as reliable and low-risk borrowers - an important factor for fostering growth and managing financial hurdles effectively.
How can a high liquidity ratio suggest inefficient use of capital?
A high liquidity ratio can sometimes signal that a business is holding onto more cash or liquid assets than necessary. While having liquidity is crucial for meeting short-term obligations, holding excessive reserves might mean the company is missing out on opportunities to invest those funds for higher returns or growth.
The key to effective capital management lies in finding the right balance - maintaining enough liquidity to handle immediate needs while using any extra funds in ways that drive productivity and expansion.
What are the challenges of using liquidity ratios to evaluate a company’s financial health?
Liquidity ratios offer a snapshot of a company’s ability to meet short-term obligations, but they come with limitations that can lead to misleading conclusions when used in isolation. These ratios are static, representing a single moment in time, which means they might overlook cash flow challenges that occur at other points during the business cycle. Moreover, they don’t reflect profitability - a company could appear liquid yet face long-term struggles if it isn’t generating adequate profits.
Another issue lies in industry differences, making it tricky to compare ratios across various sectors. Since liquidity ratios rely on historical financial data, they might not accurately capture current market conditions or potential future risks. Additionally, these ratios can be swayed by accounting methods or manipulation, and they fail to account for external influences like economic shifts or the quality of assets.
To gain a more complete understanding of a company’s financial health, it’s important to pair liquidity ratios with other tools, such as cash flow analysis and profitability metrics, while also factoring in qualitative insights. This broader approach helps provide a more reliable assessment.