
RICE Scoring Model with Examples
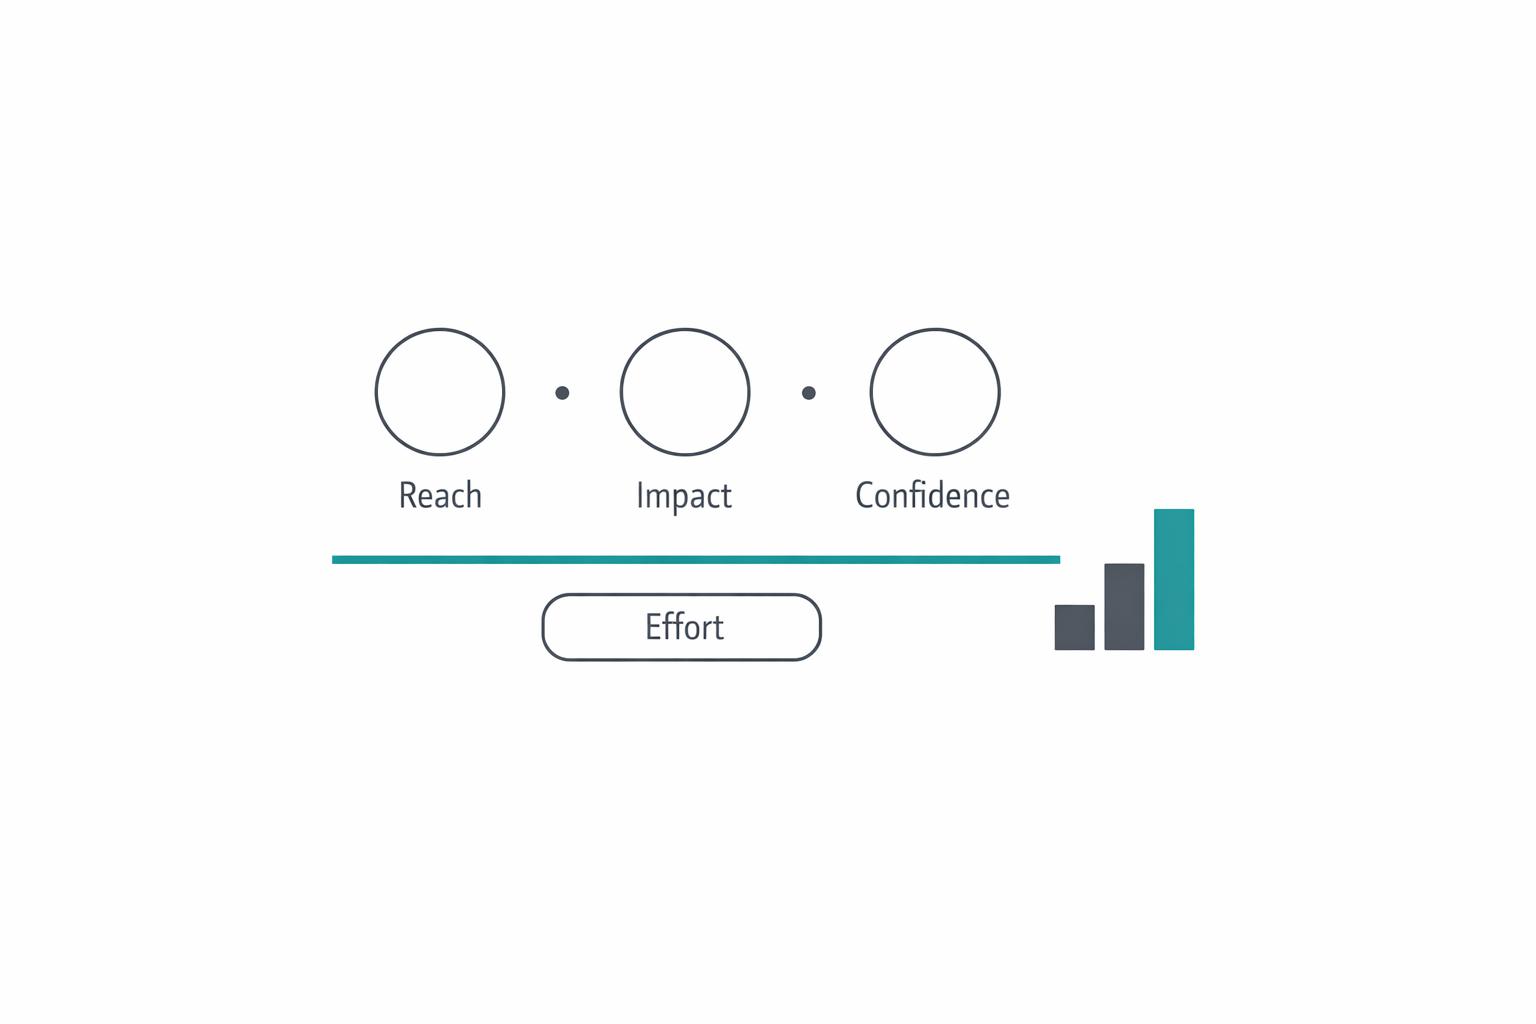
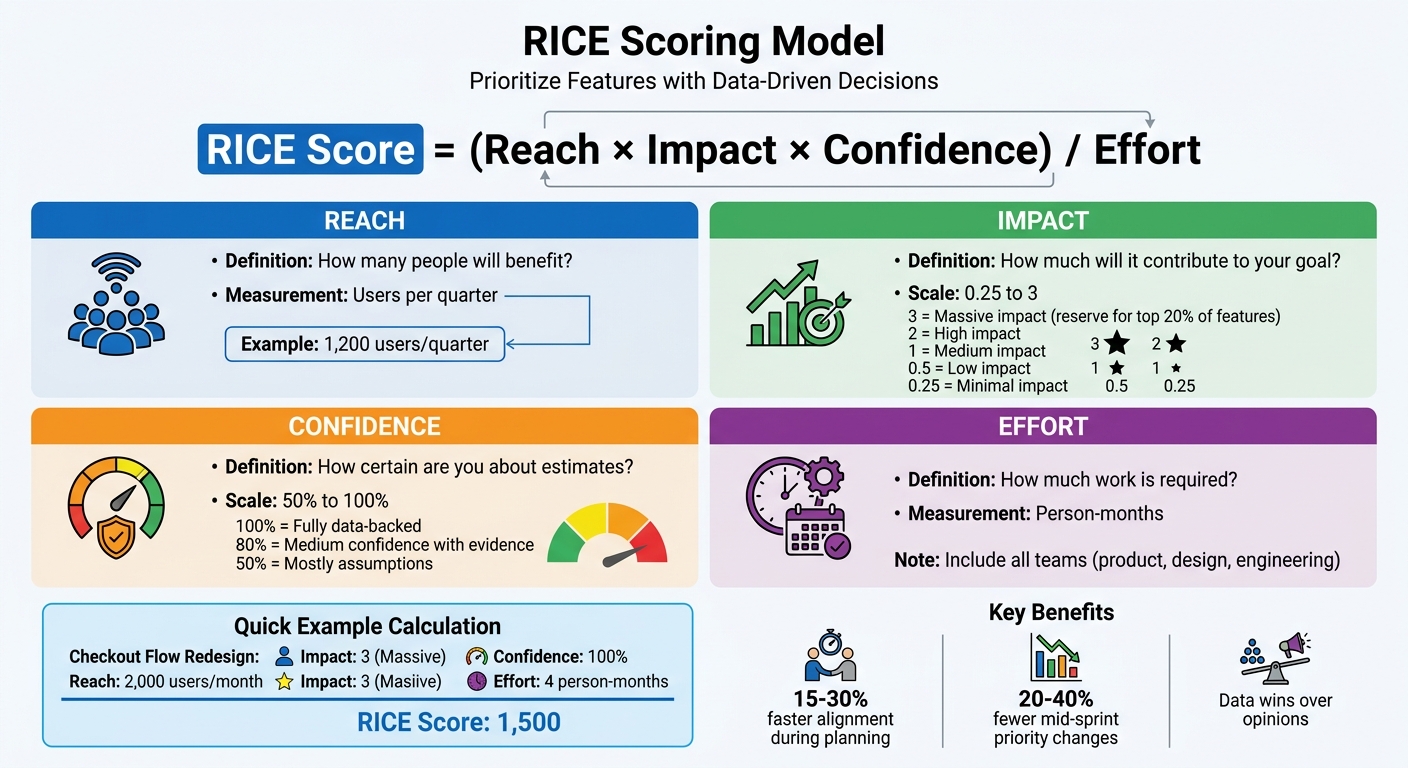
The RICE scoring model helps product teams prioritize features and projects using a simple formula: (Reach × Impact × Confidence) / Effort. It provides a structured way to make decisions based on measurable factors rather than opinions or biases. Here's how it works:
- Reach: How many people will benefit from the project? (e.g., users per quarter)
- Impact: How much will it contribute to your goal? (Scale: 0.25 to 3)
- Confidence: How certain are you about your estimates? (Percentage: 50%-100%)
- Effort: How much work is required? (Measured in person-months)
Key Takeaways:
- RICE reduces guesswork by quantifying priorities.
- It ensures alignment across teams by using clear, consistent criteria.
- Examples show how RICE helps prioritize impactful projects, like redesigning checkout flows or launching subscription features, over less impactful ideas.
By using RICE, you can focus resources on initiatives that offer the most value with the least effort, while avoiding wasted time on low-priority tasks.
RICE Scoring Model Formula and Framework Guide
Understanding the RICE Formula
The RICE Formula
Let’s break down how to calculate and use the RICE score, step by step. The formula itself is straightforward: (Reach × Impact × Confidence) / Effort [2]. You multiply Reach, Impact, and Confidence together, then divide by Effort. The outcome is a single number that reflects the value delivered per unit of work. This makes it much simpler to compare various projects or ideas on a consistent scale.
How to Score Each Factor
Scoring each factor accurately requires both discipline and reliable data. Here’s how you can approach each component:
- Reach: Use actual analytics instead of vague guesses. For example, if you're working on a settings page, check how many unique users interact with it over a specific time frame - say, 1,200 users per quarter - instead of relying on broad terms like "most customers" or "all users."
- Impact: Tie this score directly to your business goals. A feature that significantly increases conversion rates might score a 3, while a minor change to the user interface might only score 0.5. Reserve scores of 3 for a small percentage of features - no more than 20% - to avoid inflating expectations.
-
Confidence: Base this on the strength of your evidence. For example:
- 100% for fully data-backed estimates
- 80% for medium confidence with some supporting evidence
- 50% when relying mostly on assumptions Scores below 50% signal high uncertainty and should be approached with caution. If an idea hasn’t been validated through methods like user research or A/B testing, it’s safer to stick with 50% to maintain honesty in your planning.
- Effort: Get input from the team responsible for building the feature. Use whole numbers or half increments (e.g., 2 or 2.5 person-months) to keep things simple. Make sure this includes the effort required from all relevant teams - product, design, and engineering - to capture the full scope of work.
Once you’ve assigned clear scores to each factor, you’ll be ready to organize them in a structured way for better comparisons.
Using a Scoring Table
A scoring table is a practical tool for keeping everything transparent and organized. Set up columns for each initiative’s name, Reach, Impact, Confidence, Effort, and the final RICE score. This format ensures that all details are visible and easy to compare. It also helps spot inconsistencies, ensuring scores are well-justified. When everyone can see the math behind decisions, discussions shift from subjective opinions to data-driven insights.
sbb-itb-8feac72
Case Studies: RICE Model in Action
Case Study 1: Improving User Onboarding
The "Review onboarding flow" initiative underwent evaluation using the RICE framework. Analytics revealed that 1,200 new users per quarter interacted with the onboarding sequence. The team assigned an Impact score of 2 (High), as streamlining this flow aligned directly with their goal of reducing time-to-first-value. With 80% Confidence derived from user feedback surveys and an Effort estimate of 1.5 person-months, the RICE score totaled 1,250. This placed the onboarding project third among competing initiatives [5][1]. Let’s now look at how a similar approach helped optimize a critical revenue-generating process.
Case Study 2: Optimizing the Checkout Flow
In April 2026, Abrar Abutouq, a Product Manager at Userpilot, showcased how the RICE model prioritized a checkout flow redesign over other features. Event analytics identified 2,000 users per month reaching the checkout entry page. The team assigned an Impact score of 3 (Massive) because funnel drop-off data indicated this directly influenced revenue goals. With 100% Confidence, backed by solid analytics, and an Effort estimate of 4 person-months, the checkout redesign achieved a RICE score of 1,500.
By comparison, a Dark Mode feature - expected to reach 5,000 users - scored only 666 due to its minor business impact and an effort estimate of 3 person-months [6].
"What the calculator kills is the VP's pet project that scores 340 but 'feels strategic.'" - Abrar Abutouq, Product Manager, Userpilot [6]
This example demonstrates how RICE helps prioritize initiatives that directly impact business goals. Now, let’s see how the model guided decisions for a subscription service.
Case Study 3: Upgrading a Subscription Feature
A streaming service with 500,000 subscribers applied RICE to compare two competing feature upgrades: a Premium Tier versus Watch Parties. The Premium Tier was projected to reach 50,000 users (10% of subscribers) with an Impact score of 2 and 80% Confidence. With an Effort estimate of 2 person-months, it scored 40,000.
On the other hand, Watch Parties had the potential to reach all 500,000 users with the same Impact score of 2, but Confidence was lower at 60% due to limited validation data. Despite requiring 3 person-months, Watch Parties scored 200,000, making it the clear priority.
This case highlights an important lesson: while RICE provides a structured way to prioritize, informed judgment and context remain crucial for decision-making.
Comparing and Ranking Initiatives with RICE
Ranking Initiatives by RICE Scores
After calculating the RICE scores for your initiatives, arrange them from highest to lowest. These scores are purely for comparison - they don’t carry any absolute value. For instance, an initiative with a score of 3,000 should take precedence over one with a score of 1,500 [4].
That said, treating these scores as exact figures can be misleading. To avoid overconfidence in the numbers, group initiatives into tiers (e.g., Tier 1: 800–1,000). This method helps account for the inevitable uncertainty in your estimates. For example, a score of 998 isn’t meaningfully different from 1,002 [8].
Here’s an example of what a ranked list might look like:
| Initiative | Reach (Qtr) | Impact | Confidence | Effort (Wks) | RICE Score |
|---|---|---|---|---|---|
| Billing Reminder Sequence | 1,200 | 1.0 | 80% | 4 | 240 |
| Guided Onboarding Checklist | 900 | 2.0 | 80% | 6 | 240 |
| Bulk CSV Reliability Rewrite | 350 | 2.0 | 100% | 8 | 87.5 |
| Search Latency Improvement | 700 | 0.5 | 80% | 5 | 56 |
| Role Permission Redesign | 280 | 3.0 | 50% | 10 | 42 |
When two initiatives have the same score, you can break the tie by considering factors like strategic alignment or how time-sensitive the work is [7]. This ranking offers a starting point, but it’s not the final word - further analysis of each score’s meaning is crucial.
Interpreting the Results
Once you’ve ranked your initiatives and grouped them into tiers, it’s time to dig deeper into the implications of these scores. While RICE scores provide a helpful guide, final decisions should also factor in strategic considerations. As PM Toolkit puts it: "RICE beats politics. Data wins arguments. When someone says 'we must build this,' show the scores" [3].
Before locking in your roadmap, it’s wise to perform sensitivity checks. For example, simulate scenarios where you double the Effort or reduce Confidence by 20% to see how scores shift. This helps you identify initiatives that might carry more risk than initially apparent [7]. Another approach is to rank initiatives within specific categories like Growth, Platform, or Compliance, rather than creating one universal list [7][8].
It’s also important to recognize that exceptions will arise. Sometimes, external factors like legal deadlines, critical technical debt, or partnership obligations might push a lower-scoring initiative to the top of your list. The key is to document why this decision was made so everyone understands the reasoning [3][7][8].
Teams that use RICE effectively often report fewer in-sprint priority changes (20%–40% less) and faster alignment during planning (15%–30% quicker) [7]. The framework succeeds because it replaces subjective judgments with data-driven decisions - but only if your team consistently applies the same definitions for each variable [7].
Conclusion
Key Benefits of RICE
The RICE model shifts product prioritization from subjective debates to decisions based on clear, measurable data. Instead of allowing the loudest voice in the room to dominate, it provides product managers with a structured framework built on four quantifiable factors. As TheLinuxCode explains: "When teams do not have a clear scoring method, prioritization turns into negotiation theater. The loudest stakeholder wins, then context changes, and the list gets rewritten" [7].
This framework has a noticeable impact on team efficiency. Companies using RICE often report 15% to 30% faster alignment during planning sessions and 20% to 40% fewer mid-sprint priority changes [7]. These improvements stem from how RICE fosters a shared approach to decision-making across engineering, design, and leadership. The Confidence factor, in particular, acts as a built-in safeguard, flagging initiatives that may need more research before committing resources [7].
RICE also helps prevent wasted effort. For example, in 2025, SaaS companies reportedly spent $29.5 billion on software features that were rarely or never used [2]. By explicitly factoring in Reach and balancing potential value against Effort, the model ensures resources are directed toward projects with the highest potential return on investment.
Final Thoughts
RICE combines strategic judgment with data-backed insights, making it a practical tool rather than a rigid formula. It doesn’t replace human judgment - if anything, it enhances it. As TheLinuxCode puts it: "RICE works because it gives teams a common operating language for trade-offs. It does not remove judgment, and that is a strength, not a flaw" [7]. By forcing teams to clearly state their assumptions, it highlights gaps in knowledge and reduces the risk of overconfidence.
To get the most out of RICE, standardize scoring criteria and hold calibration sessions to define terms like "High Impact" or "Medium Effort." Then, close the feedback loop by comparing your predicted Reach and Impact with actual results after launch. Over time, this iterative process will sharpen your scoring accuracy and help you build a roadmap rooted in evidence, not guesswork.
Rice Prioritization Framework: Explanation with Examples
FAQs
How do I estimate Reach when data is limited?
When you're working with limited data, estimating Reach in the RICE model requires a bit of educated guesswork. Reach represents the number of people a feature will impact within a given time frame. If exact numbers aren't available, rely on your best judgment to make an estimate.
The key here is transparency - clearly note any uncertainty in your estimate. Indicating your confidence level helps ensure the prioritization process stays grounded and effective, even when the data isn't perfect.
What should I do if stakeholders disagree with the Impact score?
If stakeholders question the Impact score, take a step back and review the assumptions that influenced the scoring. Encourage an open discussion to clarify expectations and reach a mutual understanding of the potential impact. If needed, adjust the score to reflect this shared perspective. Transparent communication and collaboration are essential for addressing disagreements constructively.
How often should we recalibrate RICE scores after shipping?
RICE scores need regular updates, especially when a project's scope shifts, the user base evolves, or confidence in estimates changes. This helps keep prioritization accurate and aligned with the latest requirements.