
Structure of a Balance Sheet: Examples for Leaders
A balance sheet is a snapshot of a company’s financial health at a specific moment. It shows what a business owns (assets), owes (liabilities), and the value left for shareholders (equity). The basic formula is: Assets = Liabilities + Shareholders' Equity. This statement helps leaders understand liquidity, debt levels, and overall stability.
Key points:
- Assets: Split into current (cash, receivables) and non-current (property, patents).
- Liabilities: Divided by due dates - current (due within a year) and long-term (due after a year).
- Equity: The remaining value for shareholders after liabilities are subtracted from assets.
For tech companies:
- SaaS firms often have high liquidity and deferred revenue, with minimal inventory.
- Hardware companies require significant investments in inventory and equipment.
Metrics like the current ratio (liquidity) and debt-to-equity ratio (leverage) are crucial for assessing financial health. These insights guide decisions on investments, growth, and risk management.
How to Read and Understand a Balance Sheet | Business: Explained
The 3 Main Parts of a Balance Sheet
A balance sheet breaks down financial information into three key categories: assets (ordered by liquidity), liabilities (arranged by due date), and equity (representing the residual value). This structure provides a clear snapshot of financial health and helps assess operational performance.
Assets: Current and Non-Current
Assets include all resources a company owns, organized by how quickly they can be converted into cash. Current assets are expected to be used or turned into cash within a year (or one operating cycle) and typically include cash, accounts receivable, and inventory. Non-current assets (also called fixed or long-term assets) are held for longer than a year and cover items like property, equipment, patents, and goodwill.
For example, Apple’s 2020 Annual Report listed $143,713 million in current assets and $180,175 million in non-current assets, adding up to $323,888 million in total assets [5]. This breakdown highlights how a company balances short-term operations with long-term investments. Non-current assets, unlike current ones, depreciate over time. Accounts receivable, for instance, are reported at their net realizable value - what the company expects to collect after accounting for uncollectible debts.
Liabilities: Current and Long-Term
Liabilities represent a company’s financial obligations, categorized by their payment deadlines. Current liabilities are due within one year (or operating cycle) and include accounts payable, short-term loans, accrued wages, and the current portion of long-term debt. Long-term liabilities are due after 12 months and include bonds payable, long-term leases, and pension obligations.
In fiscal year 2021, Apple reported $115.868 billion in total current liabilities and $118.719 billion in long-term debt [7]. Their 10-K filing detailed specific current liabilities such as $54.763 billion in accounts payable and $6.0 billion in commercial paper. This distinction between immediate and long-term obligations is critical for understanding liquidity and working capital needs.
"The accrual method means that the balance sheet must report liabilities from the time they are incurred until the time they are paid." - Harold Averkamp, CPA, MBA [4]
Additionally, any portion of long-term debt due within 12 months is reclassified as a current liability, ensuring the balance sheet accurately reflects near-term cash requirements.
Equity: What Shareholders Own
The last section of the balance sheet, equity, represents what remains for shareholders after all liabilities are subtracted from total assets. Common components of equity include common stock (often recorded at a nominal par value), additional paid-in capital, retained earnings, and treasury stock (shares repurchased by the company that reduce total equity) [1][8].
For instance, Apple’s condensed consolidated balance sheet in September 2024 reported total assets of $364.98 billion, balanced by its liabilities and shareholders’ equity [1]. The equity section detailed components like common stock, retained earnings, and accumulated other comprehensive income. A growing equity figure often signals strong profit reinvestment and effective capital management.
"Equity in accounting is the remaining value of an owner's interest in a company after subtracting all liabilities from total assets." - FreshBooks [8]
It’s important to note the difference between book value (equity shown on the balance sheet) and market value, which can be much higher if the company benefits from unrecorded intangibles like brand loyalty. For tech companies, keeping an eye on retained earnings helps gauge whether profits are being reinvested wisely or if the company is taking on too much debt.
Balance Sheet Examples for Tech Companies
SaaS vs Hardware Company Balance Sheet Structure Comparison
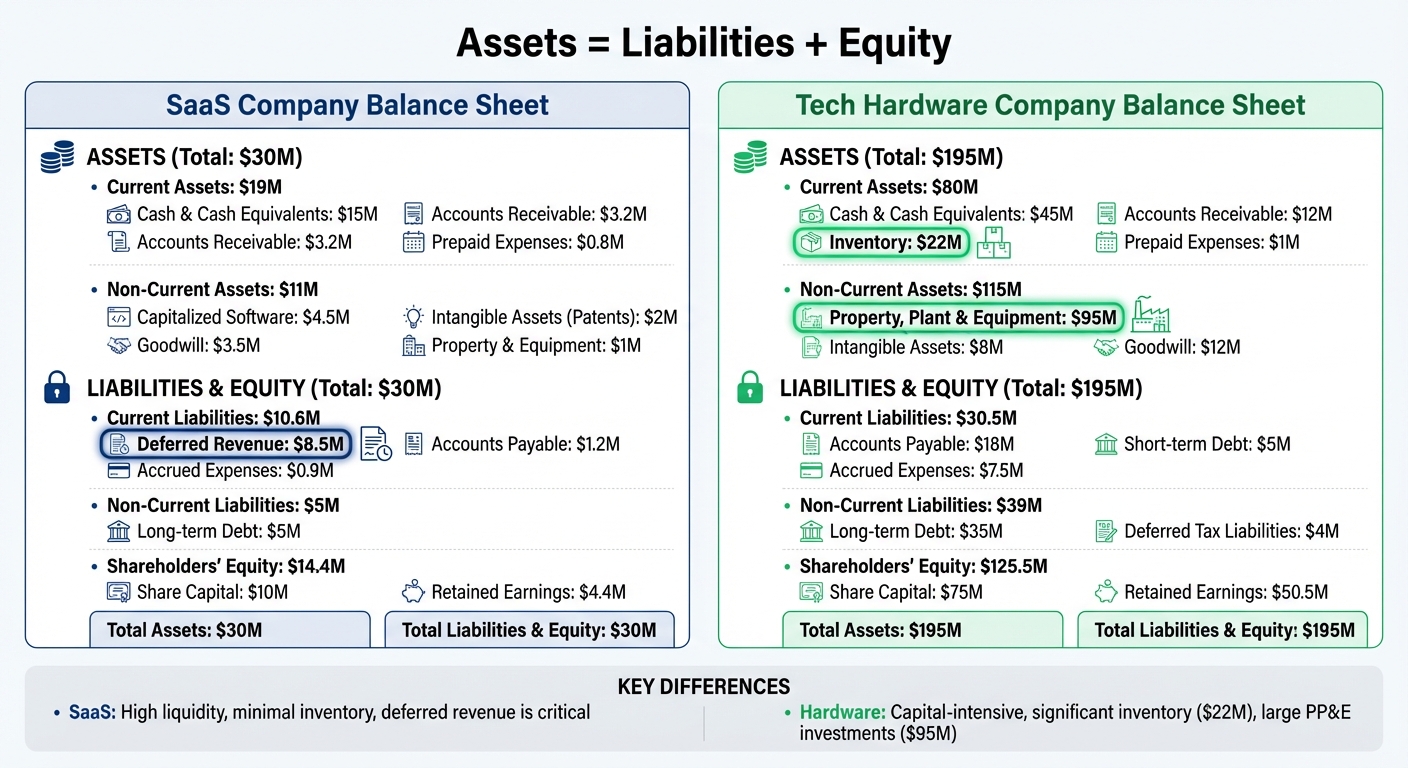
Looking at real-world balance sheets can help tech leaders better understand how different business models are reflected in financial statements. SaaS companies and hardware companies, for instance, show significant differences in their balance sheets due to their distinct operational needs. Let’s break down how these variations appear in the balance sheets of SaaS and hardware businesses.
Example: SaaS Company Balance Sheet
SaaS companies typically operate with a lightweight capital expenditure model, meaning they don’t rely heavily on physical assets [6]. Their balance sheets are characterized by high liquidity and minimal inventory. A standout feature is deferred revenue, which represents cash collected upfront for subscriptions or services that haven’t yet been delivered. This is a critical metric for evaluating revenue growth and quality.
Evan Tuck from SaaS Capital highlights this importance:
"Deferred Revenue is possibly the most important line item on a SaaS company's balance sheet. It is a non-negotiable separate account item in the Liabilities section for any SaaS company" [6].
Here’s an example of how a SaaS company’s balance sheet might look:
| Assets | Amount | Liabilities & Equity | Amount |
|---|---|---|---|
| Current Assets | Current Liabilities | ||
| Cash & Cash Equivalents | $15,000,000 | Deferred Revenue | $8,500,000 |
| Accounts Receivable | $3,200,000 | Accounts Payable | $1,200,000 |
| Prepaid Expenses | $800,000 | Accrued Expenses | $900,000 |
| Total Current Assets | $19,000,000 | Total Current Liabilities | $10,600,000 |
| Non-Current Assets | Non-Current Liabilities | ||
| Capitalized Software | $4,500,000 | Long-term Debt | $5,000,000 |
| Intangible Assets (Patents) | $2,000,000 | Total Non-Current Liabilities | $5,000,000 |
| Goodwill | $3,500,000 | Shareholders' Equity | |
| Property & Equipment | $1,000,000 | Share Capital | $10,000,000 |
| Retained Earnings | $4,400,000 | ||
| Total Non-Current Assets | $11,000,000 | Total Equity | $14,400,000 |
| TOTAL ASSETS | $30,000,000 | TOTAL LIABILITIES & EQUITY | $30,000,000 |
SaaS leaders should also keep an eye on the Allowance for Doubtful Accounts within accounts receivable. This helps gauge the reliability of customer payments and overall revenue quality [6]. Additionally, while capitalized software costs are listed as assets, they can sometimes obscure the actual cash burn rate [6].
Example: Tech Hardware Company Balance Sheet
In contrast, hardware companies operate with capital-intensive models, requiring significant investments in manufacturing facilities and inventory [2]. For example, Apple’s 2021 fiscal year balance sheet illustrated this with $39,440 million in net Property, Plant, and Equipment (about 11% of total assets) and $6,580 million in inventory [7]. This contrasts sharply with SaaS companies, which typically report little to no inventory [5].
Apple’s September 2021 financials revealed total assets of $351,002 million, with $190,516 million in cash and cash equivalents [7]. Current liabilities included $6,000 million in commercial paper (short-term debt) and accounts payable to suppliers, while shareholders’ equity totaled $63,090 million [7].
Here’s an example of a hardware company’s balance sheet:
| Assets | Amount | Liabilities & Equity | Amount |
|---|---|---|---|
| Current Assets | Current Liabilities | ||
| Cash & Cash Equivalents | $45,000,000 | Accounts Payable | $18,000,000 |
| Accounts Receivable | $12,000,000 | Accrued Expenses | $7,500,000 |
| Inventory | $22,000,000 | Short-term Debt | $5,000,000 |
| Prepaid Expenses | $1,000,000 | Total Current Liabilities | $30,500,000 |
| Total Current Assets | $80,000,000 | Non-Current Liabilities | |
| Non-Current Assets | Long-term Debt | $35,000,000 | |
| Property, Plant & Equipment | $95,000,000 | Deferred Tax Liabilities | $4,000,000 |
| Intangible Assets | $8,000,000 | Total Non-Current Liabilities | $39,000,000 |
| Goodwill | $12,000,000 | Shareholders' Equity | |
| Share Capital | $75,000,000 | ||
| Retained Earnings | $50,500,000 | ||
| Total Non-Current Assets | $115,000,000 | Total Equity | $125,500,000 |
| TOTAL ASSETS | $195,000,000 | TOTAL LIABILITIES & EQUITY | $195,000,000 |
Hardware companies also face unique financial challenges. Their balance sheets often show significant working capital tied up in inventory, including raw materials, work-in-progress, and finished goods. Leaders in this sector should calculate Net Debt (Total Liabilities minus Cash and Equivalents) to determine how much debt could be cleared by liquidating current assets. Monitoring inventory turnover ratios is also essential for measuring operational efficiency and effective cash flow management [2].
sbb-itb-8feac72
Financial Ratios Calculated from Balance Sheets
Balance sheet ratios turn raw financial figures into meaningful insights. As Andi Smiles, a Small Business Financial Consultant, explains:
"Balance sheet ratios are short formulas you can use to assess your financial health - just by looking at your balance sheet. They require very little math, yet this financial reporting with them leads to HUGE insights." [9]
These ratios help businesses evaluate various aspects of their financial health. Liquidity ratios reveal a company's ability to meet short-term obligations, while leverage ratios assess long-term stability and reliance on debt. Efficiency and profitability ratios, on the other hand, measure how well assets are being used to generate revenue and the returns on investments.
Current Ratio: Measuring Liquidity
The current ratio is a straightforward calculation: divide current assets by current liabilities. It essentially answers the question, "Can this company cover its short-term bills?" A ratio between 1.2 and 2.0 is generally considered healthy, while a ratio below 1.0 could indicate liquidity problems [10]. For example, in August 2020, Walgreens Boots Alliance had current assets of $18.073 billion and current liabilities of $27.071 billion, resulting in a current ratio of approximately 0.67 [2].
However, an overly high current ratio might suggest inefficiency, such as holding onto excess cash instead of reinvesting it for growth. For SaaS companies, which typically have little to no inventory, the current ratio and quick ratio tend to be very similar. In contrast, tech hardware companies often show a larger gap due to significant inventory holdings [9].
Debt-to-Equity Ratio: Measuring Leverage
The debt-to-equity (D/E) ratio is calculated by dividing total liabilities by shareholders' equity. A ratio between 0 and 0.5 is generally seen as healthy, while a ratio of 0.6 or higher may indicate greater financial risk [9]. Take Walmart as an example: as of January 31, 2025, the company reported total liabilities of $163.4 billion and shareholders' equity of $97.4 billion, resulting in a D/E ratio of 1.68. This means Walmart had $1.68 of debt for every dollar of equity [3].
A high D/E ratio signals increased financial risk. As Investopedia notes:
"A high debt-to-equity ratio signals financial weakness, risk, and an overreliance on debt, which is often unsustainable." [10]
It’s worth noting that tech hardware companies, due to their capital-intensive nature, often carry higher debt loads compared to SaaS firms. Therefore, it’s crucial to compare these ratios against industry standards for a more accurate assessment [10].
How Tech Leaders Can Use These Ratios
Liquidity and leverage ratios aren’t just numbers - they’re tools for making smarter financial decisions. Tracking these metrics over time can reveal trends that may need attention. For instance, a declining solvency ratio could act as an early warning of potential financial trouble [9]. As Andi Smiles puts it:
"Checking your solvency ratio is important because if you watch it decrease month over month, it means your business is in trouble. It's like a smoke detector for your finances - it alerts you that there might be a problem before your financial house goes up in flames." [9]
Tech leaders can use these insights to refine their strategies. For example, reviewing the debt-to-equity ratio before seeking additional funding can prevent potential pushback from lenders or investors wary of high leverage [1]. Similarly, for companies with substantial inventory, the quick ratio offers a sharper view of liquidity since inventory may not convert to cash quickly [10]. Lastly, benchmarking these ratios against industry norms not only helps gauge financial health but also reassures employees and stakeholders about the company’s long-term stability [1].
Conclusion
Grasping the structure of a balance sheet is a powerful tool for tech leaders. This fundamental equation shapes how you handle financial shocks, attract and retain talent, and allocate capital effectively.
As Investopedia explains:
"The balance sheet is an essential tool used by executives, investors, analysts, and regulators to understand the current financial health of a business." [1]
A balance sheet can highlight whether a company is taking on too much debt or maintaining enough liquidity to seize new opportunities. By keeping an eye on key metrics like the current ratio and debt-to-equity ratio, tech leaders can make smarter choices about raising capital - whether through borrowing or issuing equity. These metrics also help determine if the business is ready to expand into new markets or launch additional product lines. For publicly traded tech companies, a healthy balance sheet sends a strong message about job security and financial stability, which can help retain top talent. Beyond measuring performance, these ratios provide critical insights for planning future growth and funding strategies.
To get the most out of balance sheet analysis, tech leaders should evaluate it alongside historical trends, industry standards, and detailed footnotes. This approach turns raw data into actionable insights.
For those shifting from technical to strategic leadership roles, mastering balance sheet analysis can sharpen your decision-making skills. It equips you to safeguard your company’s financial health while steering it toward lasting success.
FAQs
What are the key differences in balance sheet structures between SaaS and hardware companies?
SaaS and hardware companies have noticeably different balance sheet structures, shaped by their unique business models. SaaS companies typically focus on recurring revenue streams, which means you'll often see higher deferred revenue on their balance sheets and minimal inventory. On the other hand, hardware companies deal with physical products, so their balance sheets show substantial investments in inventory and fixed assets.
SaaS businesses often shine a spotlight on their income statements to highlight growth metrics like annual recurring revenue (ARR). In contrast, hardware companies experience more fluctuations in their balance sheets, driven by production cycles and inventory demands. These variations underscore how each type of business allocates resources based on its operational priorities.
What are the key financial ratios for evaluating a company's liquidity and leverage?
When examining a company's liquidity, key metrics to consider include the current ratio, quick ratio (or acid-test ratio), and cash ratio. These figures shed light on whether the company has enough readily available assets to cover its short-term liabilities.
To analyze leverage, focus on the debt-to-equity ratio, debt ratio, and interest coverage ratio. These indicators show how reliant the company is on debt to fund its operations and how well it can handle the associated financial obligations.
Why is deferred revenue important on a SaaS company's balance sheet?
Deferred revenue plays a key role for SaaS companies as it represents money collected upfront for services or subscriptions that are yet to be provided. On the balance sheet, this is recorded as a liability, showing the company’s commitment to deliver those services in the future.
For investors and stakeholders, deferred revenue offers a glimpse into the company’s potential for recurring revenue and its overall cash flow stability. It reflects steady income streams while underscoring the importance of consistently delivering value to customers over time.